2802 W Foothill Dr -- #15 · Phoenix, AZ
Flood risk 1/10 · Minimal
- FEMA flood zone
- X (shaded)
- Chance of flooding over 30 yrs
- 0.0%
- Est. flood insurance / yr
- $507 – $1,088
Fire risk 5/10 · Moderate
- Est. fire insurance / yr
- $610 – $1,132
Heat risk 9/10 · Severe
- Hot days now (above 111°F)
- 7 days/yr
- Hot days in 30 yrs
- 18 days/yr
Wind risk 1/10 · Minimal
- Chance of severe wind over 30 yrs
- —
Air-quality risk 3/10 · Minor
- Unhealthy air days now
- 2 days/yr
- Unhealthy air days in 30 yrs
- 3 days/yr
Risk factors via First Street. Map © Google.
Why this score? — see what drove the D+ grade
The composite is a weighted blend of 9 inputs, each scored 0–100. Each bar is that input's sub-score; the figure is the points it added to the 100-point composite (weight × sub-score).
- Cash flow +15.0/30.0
- ARV discount +7.5/15.0
- 1% rule +5.0/10.0
- DSCR +5.0/10.0
- Schools +4.7/10.0
- Livability +3.8/5.0
- Rent growth +2.9/5.0
- Condition / age +2.2/5.0
- Appreciation +0.0/10.0
$34,000
🖨 Deal sheet 📄 Offer letter ✓ Due diligence
Listing remarks MLS
Well-located lot in a desirable North Phoenix area near Cave Creek Rd and Loop 101. Perfect opportunity to own in a quiet community with mountain views and easy access to nearby schools, parks, and shopping. Utilities available and ready for your new manufactured home or custom build. Buyer to verify all facts, figures, and utilities.
Key facts
- Well-located lot
- Quiet community
- Mountain views
Tags
Neighborhood map
What this means for you Summary
Snapshot
- This is a 2-bed/1.0-bath manufactured listed at $34k. Condition is rated fair.
Deal economics
- At list price, monthly cash flow is $1k ($12k/yr) — positive.
- The deal already cash-flows at list — no discount required.
- Meets the 1% rule at list price ($2k rent vs $34k).
- Recommended offer: $30k (12.0% below list) — sets the bar for market timing.
- Cap rate 42.1% vs local median 3.3% in Phoenix — top-decile yield for the area; either an underpriced asset or a hidden risk that comps aren't pricing in. Stress-test before assuming the spread holds.
Location & tenants
- Location reads 75/100 on livability (#16 in AZ, #3,924 nationally) — a middle-class / working-renter tenant base. Strengths: amenities A+, commute A+, housing A+; Watch: health & safety C-, crime F.
- Deer Valley Unified District (4246) (urban): math 50% / reading 55% proficiency, ranked #33 of 249 in AZ (top 13%) — acceptable for families but not a draw, mixed tenant base, ~2y average lease.
- Market conditions: Rents rising (+1.4%/yr); 201 active listings in the ZIP; 29 comparable units currently listed for rent nearby; rentals at typical pace (median 15d on market — plan ~3-4 weeks tenant-placement turnaround); solid renter incomes; 36,011 units permitted in Maricopa County in 2024 (12,801 in 5+ unit buildings).
- This rent is only 18% of the median local income ($107k/yr) — well below the 30% rent-burden line; pricing power to push rent on renewal without tenant pushback.
Forward outlook
- Local home prices are declining (-3.0%/yr); year-one equity from $235 of loan paydown is wiped out by about $1k of value loss. Plan a longer hold.
- Maricopa County population projected at +38% by 2050 — long-run rental-demand tailwind backs the buy-and-hold thesis.
- At projected returns (-3.0% appreciation + 1.4% rent growth), your $10k cash investment doubles in ~1 year — after that, you're playing with house money.
Negotiation context
- It's been on market 251 days — a 12% lower offer ($30k) is reasonable based on typical stale-listing flexibility.
Risks & watch-outs
- Climate carrying-cost: moderate wildfire risk; extreme-heat days projected 7→18/yr by 2055 (HVAC capex compounding) — expect insurance premiums to compound above CPI over the hold.
Questions for the listing agent
- It's been on market 251 days. Have you received any prior offers? Is the seller open to a 12% concession, seller financing, or rate buy-down credit?
- Have any recent inspections been done? Can we get a copy of the seller's disclosures and any deferred-maintenance estimates?
- Built in 1968 — when were the roof, HVAC, electrical panel, plumbing, and water heater last replaced?
- Why hasn't it sold? Are there any deal-killer items the seller is aware of (foundation, flood, title, zoning, code violations)?
- Is there a deadline driving the sale (1031 exchange, divorce, estate, relocation)? That informs how much negotiation room exists.
- Crime grade is F in this area — have there been break-ins, vandalism, or insurance claims at this property in the last 3 years? What carrier currently insures it and at what premium?
- The area grade is low — what's the realistic commute time and amenity access for the typical tenant pool here? Any planned neighborhood developments (good or bad) we should know about?
- What's the average days-on-market for RENTAL listings here right now (not sales)? A rising rental-DOM trend means longer vacancies and softer asking-rent achievability than the comps imply.
- What's the recent tenant-quality profile in this submarket — average credit score on applications, eviction rate, late-payment / NSF rate, and stable-employment percentage? A property-management company in the area should have these aggregated.
- How much new for-sale + rental construction is in the pipeline within 1–3 miles? Heavy new supply typically softens prices + rents 12–24 months out; constrained supply supports both.
Investment metrics
- 1% rule
- 4.65% ✓
- Cap rate
- 42.07%
- Cash-on-cash
- 127.77%
- DSCR
- 6.68
- GRM
- 1.8
CMA / ARV
- ARV (median comp)
- $192,602
- List price
- $34,000
- Delta
- -82.35%
- Verdict
- UNDERPRICED
- Comps
- 7 within 2.0 mi
Show comp detail 1 sale within ~0.75 mi
| Address | Dist | Beds/Ba | Sqft | Sold | Price | $/sf | Match |
|---|---|---|---|---|---|---|---|
| 2709 W Robin Ln | 0.10mi | 3/2.0 (+1) | 1,056 (+11%) | 8mo | $247,500 | $234 | 61 |
Match score weights: distance 35% · size 25% · config 20% · recency 20%. Top-matched comps best support the ARV.
Projected returns pro-forma
-3.0% appreciation · 1.44% rent growth · sell at horizon
- IRR
- —
- Equity multiple
- 6.95×
- Total profit
- $56,629
- Equity at exit
- $5,070
- IRR
- —
- Equity multiple
- 13.90×
- Total profit
- $122,821
- Equity at exit
- $2,940
Cash invested: $9,520 (down + closing). Projections, not guarantees.
Landlord ↔ Tenant lean methodology
- Overall (STATE)
- 87 Strongly Landlord-Friendly
- State Arizona
- 87 Strongly Landlord-Friendly · R+3
- County
- — inherits STATE
- City
- — inherits STATE
ZIP-level market 85024
- Home prices YoY
- -21.0%
- Rents YoY
- 1.4%
- Active inventory
- 201
- Price-to-rent
- 1.8×
Monthly cashflow live
- Estimated rent
- $1,580 high interval (Pro) →
- Mortgage (P&I)
- −$178
- Tax est. 1.5%
- −$42 /mo · $510/yr
- Insurance
- −$14
- HOA
- −$0
- Vacancy / Maint / Mgmt
- −$332
- Net cashflow
- $1,014
Break-even live
UW: 25.0% down · 7.5% · 30yr · 1.5% tax · 5.0% vac · 8.0% maint · 8.0% mgmt
Financing live
Cash to close
- Down payment
- $8,500
- Closing costs
- $1,020
- Reserves months
- —
- Total cash needed
- —
Loan-product check · same deal, 3 products live
Conventional
25% down · 7.5% · 30yr
- Down + closing
- —
- Monthly P&I
- —
- Monthly cashflow
- —
- DSCR
- —
- Eligible?
- —
Personal DTI + credit; lowest rate.
DSCR
20% down · 8.5% · 30yr
- Down + closing
- —
- Monthly P&I
- —
- Monthly cashflow
- —
- DSCR
- —
- Eligible?
- —
No personal income docs; deal must DSCR.
Hard money
10% down · 12.0% · 12mo
- Down + closing
- —
- Monthly P&I
- —
- Monthly cashflow
- —
- DSCR
- —
- Eligible?
- —
Short-term bridge; refi at stabilization.
Rent comps 29 comps
| Address | Beds | Baths | Sqft | Rent | $/sqft | DOM | Units | Dist |
|---|---|---|---|---|---|---|---|---|
| 3021 W Williams Dr Phoenix, AZ | 2.0 | 2.0 | 830 | $1,450 | $1.75 | 44d | 6 | 0.28mi |
| 3132 W Robin Ln Phoenix, AZ | 3.0 | 2.0 | 1086 | $1,781 | $1.64 | 13d | 1 | 0.43mi |
| 2811 W Deer Valley Rd Phoenix, AZ | 2.0 | 2.0 | 952 | $1,448 | $1.52 | 5d | 1 | 0.50mi |
| 2811 W Deer Valley Rd Phoenix, AZ | 2.0 | 2.0 | 952 | $1,527 | $1.60 | 44d | 1 | 0.50mi |
| 2811 W Deer Valley Rd Phoenix, AZ | 1.0 | 1.0 | 717 | $1,259 | $1.76 | 15d | 1 | 0.50mi |
| 23350 N 23rd Ave Phoenix, AZ | 1.0–3.0 | 1.0–2.0 | 983 | $2,174 | $2.21 | 2d | 23 | 0.72mi |
| 3257 W Melinda Ln Phoenix, AZ | 3.0 | 2.0 | 1101 | $2,086 | $1.89 | 24d | 1 | 0.73mi |
| 21632 N 23rd Ave Apt 14 Phoenix, AZ | 2.0 | 1.0 | 800 | $750 | $0.94 | 8d | 1 | 0.78mi |
| 21632 N 23rd Ave Apt 12 Phoenix, AZ | 2.0 | 1.0 | 800 | $750 | $0.94 | 44d | 1 | 0.78mi |
| 21622 N 23rd Ave Unit 304B Phoenix, AZ | 2.0 | 1.0 | 768 | $1,095 | $1.43 | 44d | 1 | 0.82mi |
| 21622 N 23rd Ave Phoenix, AZ | 2.0 | 1.0 | 768 | $1,047 | $1.36 | 18d | 2 | 0.82mi |
| 3049 W Covey Ln Phoenix, AZ | 3.0 | 2.0 | 1101 | $1,850 | $1.68 | 44d | 1 | 0.85mi |
| 2222 W Parkside Ln Phoenix, AZ | 1.0–3.0 | 1.0–2.0 | 987 | $1,590 | $1.61 | 8d | 1 | 0.87mi |
| 21450 N 23rd Ave Phoenix, AZ | 1.0 | 1.0 | 700 | $899 | $1.28 | 15d | 3 | 0.87mi |
| 2330 W Lone Cactus Dr Unit 204 Phoenix, AZ | 2.0 | 2.0 | 995 | $1,595 | $1.60 | 44d | 1 | 0.90mi |
| 2330 W Lone Cactus Dr Unit 103 Phoenix, AZ | 2.0 | 2.0 | 995 | $1,495 | $1.50 | 44d | 1 | 0.90mi |
| 21420 N 23rd Ave Phoenix, AZ | 1.0 | 1.0 | 550 | $860 | $1.56 | 2d | 3 | 0.92mi |
| 3425 W Deer Valley Rd Phoenix, AZ | 1.0–3.0 | 1.0–2.0 | 963 | $1,848 | $1.92 | 3d | 8 | 0.92mi |
| 2324 W Lone Cactus Dr Unit 11 Phoenix, AZ | 2.0 | 1.0 | 920 | $1,099 | $1.19 | 44d | 1 | 0.93mi |
| 23700 N 23rd Ave Phoenix, AZ | 1.0–3.0 | 1.0–2.0 | 935 | $3,304 | $3.53 | 8d | 1 | 0.94mi |
| 21220 N 23rd Ave Phoenix, AZ | 2.0 | 2.0 | 1065 | $1,415 | $1.33 | 13d | 6 | 0.99mi |
| 20808 N 27th Ave Phoenix, AZ | 1.0–3.0 | 1.0–2.0 | 962 | $1,548 | $1.61 | 3d | 14 | 1.08mi |
| 1905 W Pinnacle Peak Rd Phoenix, AZ | 1.0–2.0 | 1.0 | 637 | $2,045 | $3.21 | 24d | 1 | 1.22mi |
| 20601 N 33rd Ave Phoenix, AZ | 3.0 | 2.0 | 1085 | $2,100 | $1.94 | 24d | 1 | 1.31mi |
| 24250 N 23rd Ave Phoenix, AZ | 1.0–2.0 | 1.0–2.0 | 948 | $1,815 | $1.91 | 1d | 27 | 1.31mi |
| 2142 W Monona Dr Phoenix, AZ | 3.0 | 2.0 | 1092 | $1,790 | $1.64 | 22d | 1 | 1.32mi |
| 2150 W Alameda Rd Phoenix, AZ | 2.0–4.0 | 2.0–3.0 | 1400 | $1,700 | $1.21 | 13d | 2 | 1.34mi |
| 20245 N 32nd Dr Phoenix, AZ | 1.0–2.0 | 1.0–2.0 | 834 | $1,530 | $1.83 | 3d | 14 | 1.38mi |
| 3817 W Camino Real Glendale, AZ | 3.0 | 2.0 | 1041 | $2,100 | $2.02 | 24d | 1 | 1.46mi |
Listing history 15 events
-
2026-06-18days on market $34,000 Active 251 DOM
-
2026-06-17days on market $34,000 Active 250 DOM
-
2026-06-16days on market $34,000 Active 249 DOM
-
2026-06-15days on market $34,000 Active 248 DOM
-
2026-06-13days on market $34,000 Active 246 DOM
-
2026-06-13days on market $34,000 Active 245 DOM
-
2026-06-09days on market $34,000 Active 242 DOM
-
2026-06-08days on market $34,000 Active 241 DOM
-
2026-06-07days on market $34,000 Active 240 DOM
-
2026-06-04days on market $34,000 Active 237 DOM
-
2026-06-03days on market $34,000 Active 236 DOM
-
2026-06-02days on market $34,000 Active 235 DOM
-
2026-06-01days on market $34,000 Active 234 DOM
-
2026-05-31days on market $34,000 Active 233 DOM
-
2025-10-10$34,000 Active 336-char remark
Show marketing remark (336 chars)
Well-located lot in a desirable North Phoenix area near Cave Creek Rd and Loop 101. Perfect opportunity to own in a quiet community with mountain views and easy access to nearby schools, parks, and shopping. Utilities available and ready for your new manufactured home or custom build. Buyer to verify all facts, figures, and utilities.
ⓘ Source: listings_history table (triggers on properties + properties_extension) + one-shot
backfill from property_details.listing_events for pre-trigger history.
Climate risk First Street
- Flood 1/10 Low FEMA zone X (shaded) · 0% chance over 30 yrs
- Wildfire 5/10 Major
- Heat 9/10 Extreme 7 d/yr ≥111°F today · 18 d/yr by 30 yrs out
- Wind 1/10 Low
- Air quality 3/10 Moderate 2 unhealthy d/yr today · 3 by 30 yrs out
Nearby sold comps map
Loading sold comps map…
Walkable amenities ~0.75 mi
Loading nearby amenities…
Taxation est. · year 1
- Rental income
- $18,966
- − Mortgage interest
- −$1,905
- − Property taxes
- −$510
- − Insurance
- −$170
- − Repairs & maintenance
- −$1,517
- − Management
- −$1,517
- − Depreciation
- −$989
- Taxable income
- $12,358
- Est. tax owed @ 24.0%
- −$2,966
- After-tax cash flow
- $9,197/yr
For passive investors: Depreciation is non-cash, so a rental often shows a tax loss while cash-flowing — sheltering income. Rental losses are passive: they offset passive income freely, and up to $25,000/yr can offset ordinary (W-2) income if you actively participate and your MAGI is under $100k (phasing out to $0 by $150k); unused losses carry forward. On sale, claimed depreciation is recaptured at up to 25%, and gains may owe capital-gains tax (a 1031 exchange can defer both). Figures are a year-1 estimate at your 24.0% rate — not tax advice; consult a CPA.
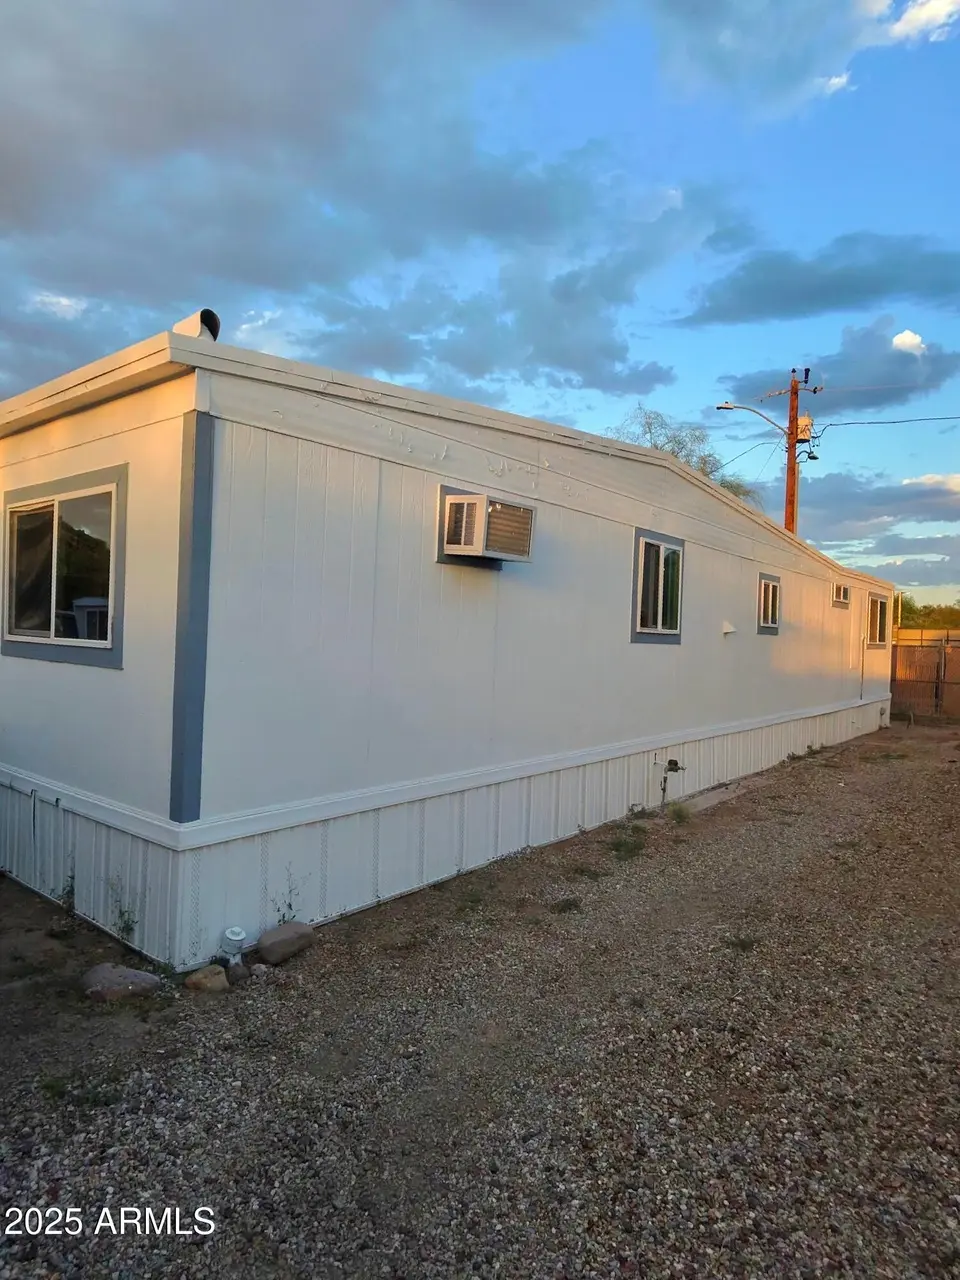
Condition & rehab AI · 3 photos
The home requires significant exterior repairs and maintenance, including painting, roof repair, and fencing repair. Landscaping and interior updates would also significantly increase its value.
Repairs flagged
- Major exterior siding — The siding is weathered and lacks paint, indicating significant wear.
- Major roof — The roof appears to be in poor condition, with visible wear and potential damage.
- Major fencing — The fencing is in poor condition, with visible damage and lack of maintenance.
Value-add opportunities
- Resale paint exterior siding — Painting the exterior siding would improve the home's curb appeal and increase its resale value.
- Resale repair roof — Repairing the roof would address a major issue and improve the home's overall condition, increasing its resale value.
- Resale repair fencing — Repairing the fencing would improve the home's curb appeal and increase its resale value.
- Rental landscaping — Landscaping the property would improve the home's curb appeal and increase its rental value.
- Both interior updates — Updating the interior would improve the home's overall condition and increase its value for both resale and rental purposes.
Renovation cost estimate screening
| Repair item | Severity | Est. cost |
|---|---|---|
| exterior siding · The siding is weathered and lacks paint, indicating significant wear. | Major | $15,000–50,000 |
| roof · The roof appears to be in poor condition, with visible wear and potential damage. | Major | $15,000–50,000 |
| fencing · The fencing is in poor condition, with visible damage and lack of maintenance. | Major | $15,000–50,000 |
| Total estimated repair cost · 3 items | $45,000–150,000 |
Value-add ROI direction
- Resale paint exterior siding — Painting the exterior siding would improve the home's curb appeal and increase its resale value. ↑
- Resale repair roof — Repairing the roof would address a major issue and improve the home's overall condition, increasing its resale value. ↑
- Resale repair fencing — Repairing the fencing would improve the home's curb appeal and increase its resale value. ↑
- Rental landscaping — Landscaping the property would improve the home's curb appeal and increase its rental value. ↑
- Both interior updates — Updating the interior would improve the home's overall condition and increase its value for both resale and rental purposes. ↑
ⓘ Cost ranges are severity-bucket heuristics (US national rule-of-thumb). Get contractor quotes + a written scope before underwriting a rehab budget.
Schools (NCES district)
- District
- Deer Valley Unified District (4246)
- NCES district ID
- 0407750
- Math proficiency
- 50% ▼ -9.00%
- Reading proficiency
- 55% ▼ -6.00%
- Median HH income
- $72,516
- Composite
- 47.0/100
- National rank
- #2346
- State rank
- #33 of 249 in AZ
Livability — Phoenix
- Score
- 75/100
- State rank
- #16
- US rank
- #3924
Category grades
Schools grade is shown separately in the Schools card above.
Census & demographics
- Census place
- Phoenix, AZ
- County
- Maricopa County · 4,537,380 people
- City population
- 1,500,198
- Metro
- Phoenix-Mesa-Chandler, AZ
- Population (ZIP)
- 26,199
- Household income
- $106,724
- Rent vs Own
- Severe rent burden
- 547.0
Population outlook (Maricopa County) Hauer SSP2
- Today (2025)
- 4,979,203 people
- By 2030
- 5,378,229 · +8.0%
- By 2040
- 6,156,598 · +23.6%
- By 2050
- 6,872,376 · +38.0%
- By 2075
- 8,401,270 · +68.7%
- By 2100
- 9,247,439 · +85.7%
Race, ethnicity, and origin ACS 2023
- Neighborhood character
- Predominantly White (71%)
- Race & ethnicity
- White 71% Hispanic / Latino 16% Two or more races 12% Asian 6% Black 2%
- Hispanic origin (detail)
- Mexican 13% Puerto Rican 1%
- Common ancestry
- Romanian 3% Italian 3% Portuguese 3%
- Foreign-born
- 12% · Canada, China, South Korea
- Languages at home
- 78% English-only · Spanish 10% Other Indo-European 4% Russian/Polish/Slavic 1%
Political lean MEDSL · Maricopa
- 2024 margin
- Toss-up / Even · D 47.7% · R 51.2% · Other 1.1%
- 2008→2024 swing
- +7.1pp toward D · 2008: -10.6pp · 2024: -3.5pp
- All cycles
- 2024: R+3.5 2020: D+2.2 2016: R+3.5 2012: R+12.0 2008: R+10.6
Not yet ingested
- Civics
- —
Market trends
- HPI YoY
- ▼ -82.95%
- Current HPI
- 312.7238
- Rent YoY
- ▲ 1.44%
- Metro
- Phoenix-Mesa-Chandler, AZ
- State GDP YoY
- ▲ 4.54%
- F500 in state
- 20
Industry mix (Fortune 500 HQ in AZ)
| Industry | F500 HQs | Revenue |
|---|---|---|
| Technology | 2 | $13B |
|
||
| Mining / Metals | 1 | $23B |
|
||
| Environmental Services | 1 | $16B |
|
||
| Metals / Steel | 1 | $14B |
|
||
| Technology Distribution | 1 | $9B |
|
||
| Homebuilding | 1 | $8B |
|
||
Price history
1 event — show timeline
- 2025-10-10 Listed $34,000 ARMLS
Cash-flow waterfall
monthlySold comps — $/sqft
last 12 mo · ≤1 miLoading sold comps…