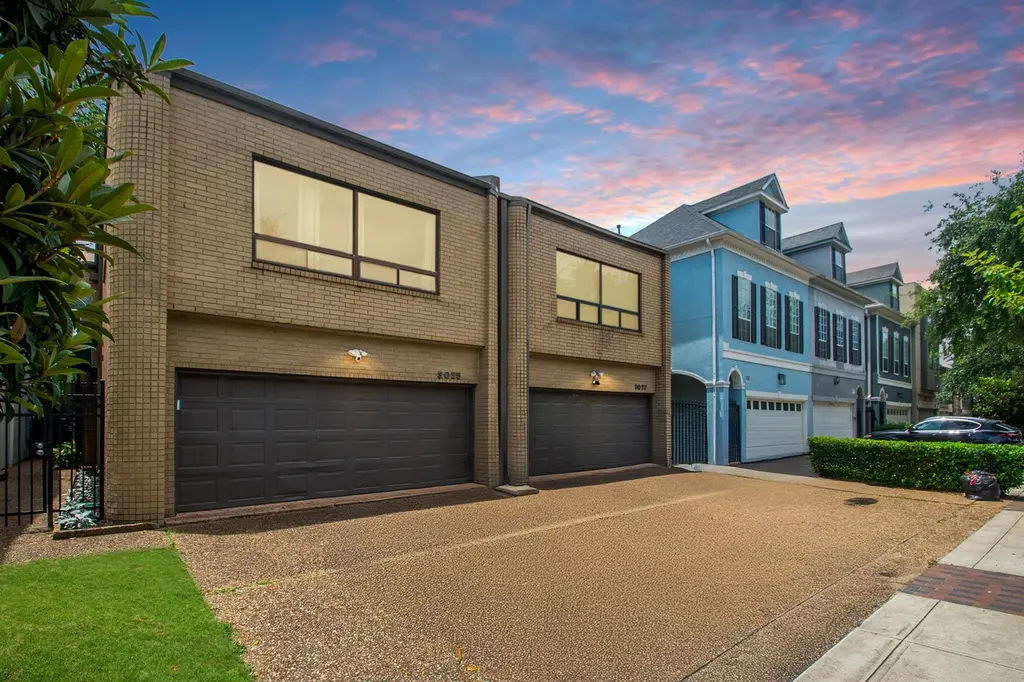
3025 Bissonnet St
West University Place, TX 77005
$379,000C
2 bd · 2.5 ba ·
2,107 sqft ·
Built 1983
· Townhouse
· Pending
· 7 DOM
Cashflow @ list (25.0% down · 7.5%)
Estimated rent
$3,945/mo
Mortgage (P&I)
−$1,988
Tax + insurance
−$771
HOA
−$0
Vac / Maint / Mgmt
−$829
Net cashflow
$358/mo
Annual
$4,300/yr
Cap rate
7.43%
Cash-on-cash
4.05%
DSCR
1.18
1% rule
1.04%
Cash to close
$106,120
Investor read
- This is a 2-bed/2.5-bath townhouse listed at $379k.
- At list price, monthly cash flow is $358 ($4k/yr) — positive.
- The deal already cash-flows at list — no discount required.
- Meets the 1% rule at list price ($4k rent vs $379k).
- Only 7 days on market — expect competitive offers; lowballing is unlikely to land.
- Local home prices are declining (-3.0%/yr); year-one equity from $3k of loan paydown is wiped out by about $11k of value loss. Plan a longer hold.
- Location reads 83/100 on livability (#12 in TX, #1,027 nationally) — a professional / high-income tenant draw. Strengths: crime A+, amenities A+, employment A+; Watch: commute D+, cost of living F.
- Houston ISD (urban): math 27% / reading 35% proficiency, ranked #593 of 826 in TX (top 72%) — families likely to look elsewhere, expect single-tenant / working-renter base with shorter leases; 71% free/reduced lunch — lower-income household profile, screen leases tightly.
- Zoned schools: West University El (math 83% / reading 87%, grade A+, #9 of 4,322 statewide, top 0%, 1,114 students, 6% FRL); Pershing Middle (math 36% / reading 49%, grade D-, #553 of 1,662 statewide, top 34%, 1,390 students, 60% FRL); Lamar H S (math 38% / reading 65%, grade D+, #478 of 1,632 statewide, top 29%, 3,125 students, 49% FRL) — zoned schools average 38% FRL vs 71% district-wide (33 pts lower); this property's tenant base skews higher-income than the district average.
- Zoned-school proficiency averages 60% at this address vs 31% district-wide (+29 pts) — the actual schools serving this property are materially stronger than the Houston ISD average implies; a family-tenant draw the district grade alone would hide.
- Market conditions: Rents rising fast (+6.0%/yr); 139 active listings in the ZIP; 40 comparable units currently listed for rent nearby; rentals leasing fast (median 11d on market — plan ~1-2 weeks tenant-placement turnaround); high-income renter base; 29,883 units permitted in Harris County in 2024 (8,621 in 5+ unit buildings).
- Harris County population projected at +47% by 2050 — long-run rental-demand tailwind backs the buy-and-hold thesis.
- 3 sale attempts since 24y ago with the ask held roughly flat each time — persistent listings suggest the price (not the market) is what's stuck; bring a comps-based counter.
- Climate carrying-cost: major flood risk; severe wind risk, 99% chance of damaging wind over 30y; extreme-heat days projected 7→24/yr by 2055 (HVAC capex compounding) — expect insurance premiums to compound above CPI over the hold.
Questions for listing agent
- Is there a deadline driving the sale (1031 exchange, divorce, estate, relocation)? That informs how much negotiation room exists.
- Schools are A-rated — typically a magnet for longer-tenancy family renters. What's the average tenant stay here, and is there a school-zone premium baked into asking?
- What's the average days-on-market for RENTAL listings here right now (not sales)? A rising rental-DOM trend means longer vacancies and softer asking-rent achievability than the comps imply.
- What's the recent tenant-quality profile in this submarket — average credit score on applications, eviction rate, late-payment / NSF rate, and stable-employment percentage? A property-management company in the area should have these aggregated.
- How much new for-sale + rental construction is in the pipeline within 1–3 miles? Heavy new supply typically softens prices + rents 12–24 months out; constrained supply supports both.
CashFlowRE · CFR-895DBE4N0AY0V6
· Data 3 weeks ago
cashflowre.app · 2026-05-29