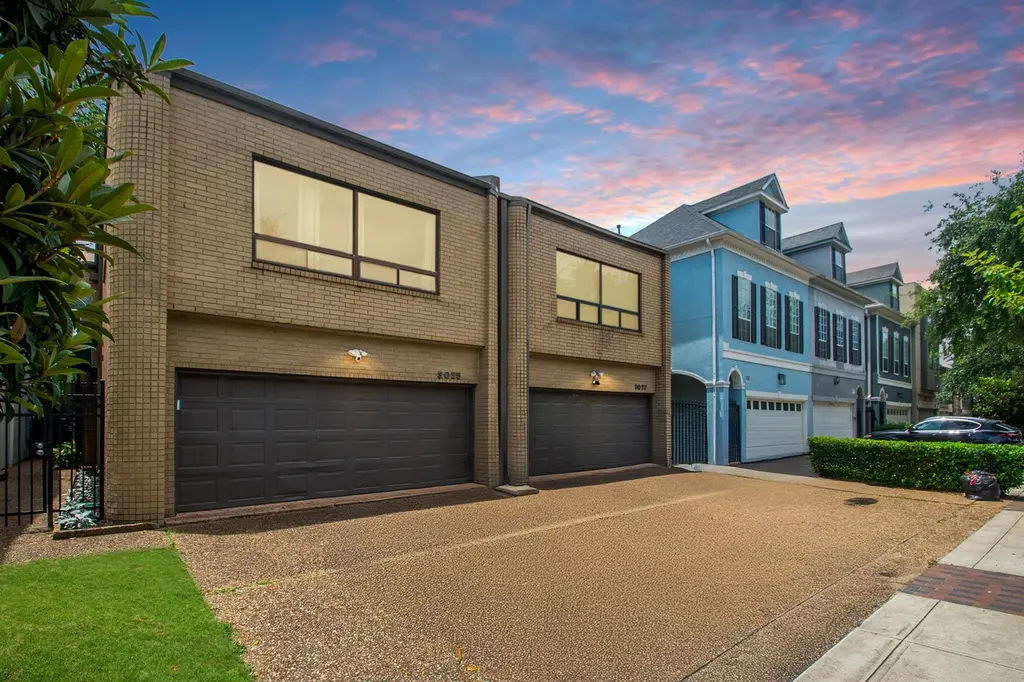
3025 Bissonnet St · West University Place, TX
Flood risk 6/10 · Moderate
- FEMA flood zone
- X (shaded)
- Chance of flooding over 30 yrs
- 0.67%
- Est. flood insurance / yr
- $507 – $1,088
Fire risk 1/10 · Minimal
- Est. fire insurance / yr
- $1,222 – $2,270
Heat risk 9/10 · Severe
- Hot days now (above 109°F)
- 7 days/yr
- Hot days in 30 yrs
- 24 days/yr
Wind risk 9/10 · Severe
- Chance of severe wind over 30 yrs
- 99.0%
Air-quality risk 2/10 · Minimal
- Unhealthy air days now
- 2 days/yr
- Unhealthy air days in 30 yrs
- 2 days/yr
Risk factors via First Street. Map © Google.
Why this score? — see what drove the C grade
The composite is a weighted blend of 9 inputs, each scored 0–100. Each bar is that input's sub-score; the figure is the points it added to the 100-point composite (weight × sub-score).
- Cash flow +18.5/30.0
- ARV discount +14.5/15.0
- DSCR +5.8/10.0
- 1% rule +5.4/10.0
- Livability +4.2/5.0
- Rent growth +4.0/5.0
- Schools +2.7/10.0
- Condition / age +2.5/5.0
- Appreciation +0.0/10.0
$379,000
🖨 Deal sheet 📄 Offer letter ✓ Due diligence
Listing remarks MLS
Spacious open floor plan. Lots of natural light. Amazing large private patio. Beautiful hardwood floors throughout. High ceilings. Two large master bedrooms. Great West University location. Priced to sell!
Key facts
- Reading nook
- Warm wood flooring
- 2 garage spots
Tags
Property features AI
Finance
- HOA & community: Curbs and gutters in community
Exterior
- Parking: Attached garage with 2 parking spaces; Garage door opener; Additional parking
- Security: Smoke detectors
- Utilities: Public water; Public sewer
- Home design: Residential property; East-facing; 2 stories; Entry level on first and second floors
- Construction: Built in 1983; Brick and wood siding construction; Metal roof; Slab foundation
- Exterior features: Fence; Paved driveway; Private yard; Concrete road surface
Interior
- Kitchen: Electric oven and electric range; Dishwasher; Disposal; Microwave; Refrigerator; Pantry; Kitchen/dining combination
- Bedrooms: Primary bedroom on second floor; Additional bedroom on second floor
- Flooring: Tile flooring; Wood flooring
- Bathrooms: 2 full bathrooms; 1 half bathroom
- Heating & cooling: Central heating (gas); Central electric air conditioning; Programmable thermostat
- Interior features: Gas log fireplace; Bath in primary bedroom; Pantry; Soaking tub; Separate shower; Tub/shower; Ceiling fans; Kitchen/dining combo; Programmable thermostat
- Laundry & utility: Washer and dryer included; Laundry located in utility room
Neighborhood map
What this means for you Summary
Snapshot
- This is a 2-bed/2.5-bath townhouse listed at $379k.
Deal economics
- At list price, monthly cash flow is $358 ($4k/yr) — positive.
- The deal already cash-flows at list — no discount required.
- Meets the 1% rule at list price ($4k rent vs $379k).
Location & tenants
- Location reads 83/100 on livability (#12 in TX, #1,027 nationally) — a professional / high-income tenant draw. Strengths: crime A+, amenities A+, employment A+; Watch: commute D+, cost of living F.
- Houston ISD (urban): math 27% / reading 35% proficiency, ranked #593 of 826 in TX (top 72%) — families likely to look elsewhere, expect single-tenant / working-renter base with shorter leases; 71% free/reduced lunch — lower-income household profile, screen leases tightly.
- Zoned schools: West University El (math 83% / reading 87%, grade A+, #9 of 4,322 statewide, top 0%, 1,114 students, 6% FRL); Pershing Middle (math 36% / reading 49%, grade D-, #553 of 1,662 statewide, top 34%, 1,390 students, 60% FRL); Lamar H S (math 38% / reading 65%, grade D+, #478 of 1,632 statewide, top 29%, 3,125 students, 49% FRL) — zoned schools average 38% FRL vs 71% district-wide (33 pts lower); this property's tenant base skews higher-income than the district average.
- Zoned-school proficiency averages 60% at this address vs 31% district-wide (+29 pts) — the actual schools serving this property are materially stronger than the Houston ISD average implies; a family-tenant draw the district grade alone would hide.
- Market conditions: Rents rising fast (+6.0%/yr); 139 active listings in the ZIP; 40 comparable units currently listed for rent nearby; rentals leasing fast (median 11d on market — plan ~1-2 weeks tenant-placement turnaround); high-income renter base; 29,883 units permitted in Harris County in 2024 (8,621 in 5+ unit buildings).
Forward outlook
- Local home prices are declining (-3.0%/yr); year-one equity from $3k of loan paydown is wiped out by about $11k of value loss. Plan a longer hold.
- Harris County population projected at +47% by 2050 — long-run rental-demand tailwind backs the buy-and-hold thesis.
Negotiation context
- Only 7 days on market — expect competitive offers; lowballing is unlikely to land.
- 3 sale attempts since 24y ago with the ask held roughly flat each time — persistent listings suggest the price (not the market) is what's stuck; bring a comps-based counter.
Risks & watch-outs
- Climate carrying-cost: major flood risk; severe wind risk, 99% chance of damaging wind over 30y; extreme-heat days projected 7→24/yr by 2055 (HVAC capex compounding) — expect insurance premiums to compound above CPI over the hold.
Questions for the listing agent
- Is there a deadline driving the sale (1031 exchange, divorce, estate, relocation)? That informs how much negotiation room exists.
- Schools are A-rated — typically a magnet for longer-tenancy family renters. What's the average tenant stay here, and is there a school-zone premium baked into asking?
- What's the average days-on-market for RENTAL listings here right now (not sales)? A rising rental-DOM trend means longer vacancies and softer asking-rent achievability than the comps imply.
- What's the recent tenant-quality profile in this submarket — average credit score on applications, eviction rate, late-payment / NSF rate, and stable-employment percentage? A property-management company in the area should have these aggregated.
- How much new for-sale + rental construction is in the pipeline within 1–3 miles? Heavy new supply typically softens prices + rents 12–24 months out; constrained supply supports both.
Investment metrics
- 1% rule
- 1.04% ✓
- Cap rate
- 7.43%
- Cash-on-cash
- 4.05%
- DSCR
- 1.18
- GRM
- 8.0
CMA / ARV
- ARV (on-the-fly)
- $448,791
- Comps found
- 12
Show comp detail 12 sales within ~0.75 mi
| Address | Dist | Beds/Ba | Sqft | Sold | Price | $/sf | Match |
|---|---|---|---|---|---|---|---|
| 3025 Bissonnet St | 0.00mi | 2/2.5 | 2,107 (0%) | 0mo | $379,000 | $180 | 100 |
| 2436 Bissonnet St #8 | 0.58mi | 3/3.5 (+1) | 2,144 (+2%) | 3mo | $457,500 | $213 | 59 |
| 3834 Lake St | 0.58mi | 3/3.0 (+1) | 2,096 (-0%) | 15mo | $400,000 | $191 | 53 |
| 3660 Lake St | 0.65mi | 2/2.5 | 1,920 (-9%) | 4mo | $380,000 | $198 | 51 |
| 2520 Robinhood St #1001 | 0.58mi | 2/2.5 | 1,902 (-10%) | 7mo | $335,000 | $176 | 51 |
| 2520 Robinhood #801 | 0.58mi | 2/3.5 | 1,902 (-10%) | 3mo | $449,000 | $236 | 51 |
| 3713 Wakeforest St | 0.57mi | 2/2.5 | 1,920 (-9%) | 10mo | $480,000 | $250 | 50 |
| 5018 Mellon St | 0.56mi | 3/3.5 (+1) | 2,042 (-3%) | 15mo | $500,000 | $245 | 47 |
| 3621 Wakeforest St | 0.64mi | 3/3.0 (+1) | 2,096 (-0%) | 20mo | $400,000 | $191 | 45 |
| 3619 Wakeforest St | 0.65mi | 2/2.5 | 1,920 (-9%) | 14mo | $389,000 | $203 | 43 |
| 3708 Lake St | 0.66mi | 3/2.5 (+1) | 1,903 (-10%) | 11mo | $495,000 | $260 | 39 |
| 3302 Audley St #103 | 0.72mi | 3/3.5 (+1) | 1,818 (-14%) | 7mo | $495,000 | $272 | 29 |
Match score weights: distance 35% · size 25% · config 20% · recency 20%. Top-matched comps best support the ARV.
Projected returns pro-forma
-3.0% appreciation · 5.95% rent growth · sell at horizon
- IRR
- -6.5%
- Equity multiple
- 0.75×
- Total profit
- $-26,392
- Equity at exit
- $56,510
- IRR
- 6.6%
- Equity multiple
- 1.56×
- Total profit
- $59,557
- Equity at exit
- $32,769
Cash invested: $106,120 (down + closing). Projections, not guarantees.
Landlord ↔ Tenant lean methodology
- Overall (STATE)
- 87 Strongly Landlord-Friendly
- State Texas
- 87 Strongly Landlord-Friendly · R+5
- County
- — inherits STATE
- City
- — inherits STATE
ZIP-level market 77005
- Rents YoY
- 6.0%
- Active inventory
- 139
- Price-to-rent
- 8.0×
Monthly cashflow live
- Estimated rent
- $3,945 high interval (Pro) →
- Mortgage (P&I)
- −$1,988
- Tax from tax record
- −$613 /mo · $7,358/yr
- Insurance
- −$158
- HOA
- −$0
- Vacancy / Maint / Mgmt
- −$829
- Net cashflow
- $358
Break-even live
UW: 25.0% down · 7.5% · 30yr · 1.5% tax · 5.0% vac · 8.0% maint · 8.0% mgmt
Financing live
Cash to close
- Down payment
- $94,750
- Closing costs
- $11,370
- Reserves months
- —
- Total cash needed
- —
Loan-product check · same deal, 3 products live
Conventional
25% down · 7.5% · 30yr
- Down + closing
- —
- Monthly P&I
- —
- Monthly cashflow
- —
- DSCR
- —
- Eligible?
- —
Personal DTI + credit; lowest rate.
DSCR
20% down · 8.5% · 30yr
- Down + closing
- —
- Monthly P&I
- —
- Monthly cashflow
- —
- DSCR
- —
- Eligible?
- —
No personal income docs; deal must DSCR.
Hard money
10% down · 12.0% · 12mo
- Down + closing
- —
- Monthly P&I
- —
- Monthly cashflow
- —
- DSCR
- —
- Eligible?
- —
Short-term bridge; refi at stabilization.
Rent comps 40 comps
| Address | Beds | Baths | Sqft | Rent | $/sqft | DOM | Units | Dist |
|---|---|---|---|---|---|---|---|---|
| 5151 Edloe St Houston, TX | 1.0–3.0 | 1.0–2.0 | 1102 | $2,102 | $1.91 | 1d | 33 | 0.41mi |
| 5141 Edloe St Houston, TX | 3.0 | 2.0 | 1552 | $2,608 | $1.68 | 24d | 1 | 0.45mi |
| 3815 Eastside St Houston, TX | 2.0 | 1.0–2.5 | 1253 | $4,459 | $3.56 | 3d | 20 | 0.48mi |
| 2508 South Blvd Houston, TX | 3.0 | 4.0 | 2514 | $3,600 | $1.43 | 24d | 1 | 0.55mi |
| 2421 Tangley St Houston, TX | 3.0 | 3.0 | 2633 | $8,323 | $3.16 | 24d | 1 | 0.71mi |
| 3833 Cummins St Houston, TX | 2.0 | 1.0–2.0 | 1161 | $2,349 | $2.02 | 3d | 23 | 0.77mi |
| 3660 Richmond Ave Houston, TX | 1.0–2.0 | 1.0–2.0 | 1084 | $2,302 | $2.12 | 2d | 19 | 0.79mi |
| 3121 Buffalo Speedway Houston, TX | 1.0–3.0 | 1.0–2.0 | 1205 | $2,106 | $1.75 | 1d | 23 | 0.83mi |
| 3333 Lake St Unit 3356 Houston, TX | 2.0 | 2.0 | 1590 | $4,668 | $2.94 | 10d | 1 | 0.85mi |
| 3333 Lake St Unit 421 Houston, TX | 2.0 | 2.0 | 1590 | $4,644 | $2.92 | 7d | 1 | 0.85mi |
| 3333 Lake St Unit 2187 Houston, TX | 2.0 | 2.0 | 1590 | $4,636 | $2.92 | 3d | 1 | 0.85mi |
| 3333 Lake St Unit 2162 Houston, TX | 2.0 | 2.0 | 1590 | $4,644 | $2.92 | 5d | 1 | 0.85mi |
| 3333 Lake St Unit 510 Houston, TX | 3.0 | 2.0 | 2650 | $10,458 | $3.95 | 11d | 1 | 0.85mi |
| 3333 Lake St Unit 3165 Houston, TX | 3.0 | 2.0 | 2650 | $10,426 | $3.93 | 3d | 1 | 0.85mi |
| 3206 Kirby Dr Houston, TX | 1.0 | 1.0 | 1850 | $3,650 | $1.97 | 43d | 1 | 0.87mi |
| 3411 Cummins St Houston, TX | 1.0–2.0 | 1.0–2.0 | 1560 | $2,349 | $1.51 | 2d | 14 | 0.94mi |
| 3131 Timmons Ln Unit 3148 Houston, TX | 3.0 | 2.0 | 1700 | $3,502 | $2.06 | 3d | 1 | 1.00mi |
| 3131 Timmons Ln Unit 3164 Houston, TX | 3.0 | 2.0 | 1700 | $3,545 | $2.09 | 12d | 1 | 1.00mi |
| 3131 Timmons Ln Unit 3174 Houston, TX | 3.0 | 2.0 | 1700 | $3,534 | $2.08 | 10d | 1 | 1.00mi |
| 2651 Kipling St Unit 3165 Houston, TX | 3.0 | 2.0 | 2739 | $11,460 | $4.18 | 3d | 1 | 1.07mi |
| 2651 Kipling St Unit 2165 Houston, TX | 2.0 | 2.0 | 1470 | $3,998 | $2.72 | 3d | 1 | 1.07mi |
| 2651 Kipling St Unit 2162 Houston, TX | 2.0 | 2.0 | 1470 | $4,006 | $2.73 | 4d | 1 | 1.07mi |
| 2719 Kipling St Unit B Houston, TX | 3.0 | 3.5 | 2184 | $4,400 | $2.01 | 43d | 1 | 1.08mi |
| 2651 Kipling St Unit 510 Houston, TX | 3.0 | 2.0 | 2739 | $11,492 | $4.20 | 11d | 1 | 1.09mi |
| 2651 Kipling St Unit 421 Houston, TX | 2.0 | 2.0 | 1470 | $4,006 | $2.73 | 7d | 1 | 1.09mi |
| 2651 Kipling St Unit 2674 Houston, TX | 2.0 | 2.0 | 1470 | $4,030 | $2.74 | 10d | 1 | 1.09mi |
| 3333 Weslayan St Houston, TX | 1.0–2.0 | 1.0–2.0 | 1095 | $2,151 | $1.96 | 3d | 25 | 1.12mi |
| 3333 Weslayan St Houston, TX | 1.0–2.0 | 1.0–2.0 | 1095 | $1,881 | $1.72 | 1d | 1 | 1.12mi |
| 2243 W Alabama St Houston, TX | 3.0 | 3.0 | 1998 | $2,440 | $1.22 | 43d | 1 | 1.13mi |
| 2829 Timmons Ln Unit 1-552 Houston, TX | 2.0 | 2.0 | 1452 | $1,985 | $1.37 | 43d | 1 | 1.16mi |
| 3805 W Alabama St Houston, TX | 1.0–2.0 | 1.0–2.0 | 1097 | $1,954 | $1.78 | 2d | 25 | 1.17mi |
| 2929 Westheimer Rd Unit 2952 Houston, TX | 2.0 | 2.0 | 1435 | $3,810 | $2.66 | 43d | 1 | 1.18mi |
| 2929 Westheimer Rd Houston, TX | 2.0 | 2.0 | 1571 | $4,090 | $2.60 | 1d | 4 | 1.18mi |
| 2701 Westheimer Rd Unit 2158 Houston, TX | 2.0 | 2.0 | 1488 | $2,211 | $1.49 | 43d | 1 | 1.19mi |
| 2796 Kirby Dr Houston, TX | 2.0 | 2.0 | 1434 | $2,177 | $1.52 | 43d | 1 | 1.21mi |
| 2727 Kirby Dr Houston, TX | 1.0–2.0 | 1.0–2.0 | 1111 | $2,581 | $2.32 | 24d | 6 | 1.21mi |
| 2727 Kirby Dr Houston, TX | 2.0 | 2.0 | 1279 | $2,292 | $1.79 | 43d | 4 | 1.21mi |
| 2727 Kirby Dr Unit 6220 Houston, TX | 2.0 | 2.0 | 1423 | $4,995 | $3.51 | 43d | 1 | 1.21mi |
| 2727 Kirby Dr Unit 1702 Houston, TX | 2.0 | 2.0 | 1672 | $5,300 | $3.17 | 43d | 1 | 1.21mi |
| 2025 Colquitt St Unit 1257741P Houston, TX | 3.0 | 3.5 | 2594 | $7,405 | $2.85 | 43d | 1 | 1.23mi |
Listing history 9 events
-
2026-05-20$379,000 Active
-
2011-12-07soldstatus
-
2011-11-29soldstatus 205-char remark
Show marketing remark (205 chars)
Spacious open floor plan. Lots of natural light. Amazing large private patio. Beautiful hardwood floors throughout. High ceilings. Two large master bedrooms. Great West University location. Priced to sell!
-
2011-10-13historical 205-char remark
Show marketing remark (205 chars)
Spacious open floor plan. Lots of natural light. Amazing large private patio. Beautiful hardwood floors throughout. High ceilings. Two large master bedrooms. Great West University location. Priced to sell!
-
2010-12-06$277,000 205-char remark
Show marketing remark (205 chars)
Spacious open floor plan. Lots of natural light. Amazing large private patio. Beautiful hardwood floors throughout. High ceilings. Two large master bedrooms. Great West University location. Priced to sell!
-
2003-04-22soldstatus
-
2003-02-12historical
-
2002-10-21$295,000
-
1988-01-02soldstatus
ⓘ Source: listings_history table (triggers on properties + properties_extension) + one-shot
backfill from property_details.listing_events for pre-trigger history.
Tax reassessment forecast TX · Resets to sale price
- Current annual tax
- $7,358 · $613/mo
- Projected year-2 tax
- $7,358 · $613/mo
- Expected delta
- $0/yr ($0/mo · 0.0%)
ⓘ Screening estimate from a state-policy table — verify with the county assessor before closing.
Climate risk First Street
- Flood 6/10 Major FEMA zone X (shaded) · 67% chance over 30 yrs
- Wildfire 1/10 Low
- Heat 9/10 Extreme 7 d/yr ≥109°F today · 24 d/yr by 30 yrs out
- Wind 9/10 Extreme 99% chance of damaging wind over 30 yrs
- Air quality 2/10 Low 2 unhealthy d/yr today · 2 by 30 yrs out
Nearby sold comps map
Loading sold comps map…
Walkable amenities ~0.75 mi
Loading nearby amenities…
Taxation est. · year 1
- Rental income
- $47,345
- − Mortgage interest
- −$21,230
- − Property taxes
- −$7,358
- − Insurance
- −$1,895
- − Repairs & maintenance
- −$3,788
- − Management
- −$3,788
- − Depreciation
- −$11,025
- Taxable loss
- −$1,738
- Est. tax savings @ 24.0%
- +$417
- After-tax cash flow
- $4,717/yr
For passive investors: Depreciation is non-cash, so a rental often shows a tax loss while cash-flowing — sheltering income. Rental losses are passive: they offset passive income freely, and up to $25,000/yr can offset ordinary (W-2) income if you actively participate and your MAGI is under $100k (phasing out to $0 by $150k); unused losses carry forward. On sale, claimed depreciation is recaptured at up to 25%, and gains may owe capital-gains tax (a 1031 exchange can defer both). Figures are a year-1 estimate at your 24.0% rate — not tax advice; consult a CPA.
Schools (NCES district)
- District
- Houston ISD
- NCES district ID
- 4823640
- Math proficiency
- 27% ▼ -18.00%
- Reading proficiency
- 35% ▼ -6.00%
- Median HH income
- $46,054
- Composite
- 26.63/100
- National rank
- #7173
- State rank
- #593 of 826 in TX
Livability — West University Place
- Score
- 83/100
- State rank
- #12
- US rank
- #1027
Category grades
Schools grade is shown separately in the Schools card above.
Census & demographics
- Census place
- West University Place, TX
- County
- Harris County · 4,702,590 people
- City population
- 28,231
- Metro
- Houston-The Woodlands-Sugar Land, TX
- Population (ZIP)
- 28,874
- Household income
- $229,267
- Rent vs Own
- Severe rent burden
- 753.0
Population outlook (Harris County) Hauer SSP2
- Today (2025)
- 5,571,493 people
- By 2030
- 6,089,821 · +9.3%
- By 2040
- 7,142,806 · +28.2%
- By 2050
- 8,185,864 · +46.9%
- By 2075
- 10,574,329 · +89.8%
- By 2100
- 12,109,958 · +117.4%
Race, ethnicity, and origin ACS 2023
- Neighborhood character
- Predominantly White (68%)
- Race & ethnicity
- White 68% Asian 14% Two or more races 11% Hispanic / Latino 9% Black 3%
- Hispanic origin (detail)
- Mexican 5%
- Common ancestry
- Italian 3% Slovak 3% Romanian 3%
- Foreign-born
- 18% · Canada, China, South Korea
- Languages at home
- 75% English-only · Spanish 8% Chinese 6% Other Indo-European 4%
Political lean MEDSL · Harris
- 2024 margin
- Lean D (+5.5) · D 52.0% · R 46.4% · Other 1.6%
- 2008→2024 swing
- +3.9pp toward D · 2008: 1.6pp · 2024: 5.5pp
- All cycles
- 2024: D+5.5 2020: D+13.3 2016: D+12.4 2012: D+0.1 2008: D+1.6
Not yet ingested
- Civics
- —
Market trends
- HPI YoY
- ▼ -630.44%
- Current HPI
- 247.3475
- Rent YoY
- ▲ 5.95%
- Metro
- Houston-The Woodlands-Sugar Land, TX
- State GDP YoY
- ▲ 3.95%
- F500 in state
- 110
Industry mix (Fortune 500 HQ in TX)
| Industry | F500 HQs | Revenue |
|---|---|---|
| Energy | 16 | $1,198B |
|
||
| Technology | 5 | $198B |
|
||
| Engineering / Construction | 4 | $72B |
|
||
| Energy Services | 3 | $60B |
|
||
| Utilities | 3 | $41B |
|
||
| Healthcare | 2 | $330B |
|
||
Price history
+28.5% since first listed9 events — show timeline
- 2026-05-20 Listed $379,000 HARMLS
- 2011-12-07 Sold (Public Records) — Public Records
- 2011-11-29 Sold (MLS) — HARMLS
- 2011-10-13 Listing Removed — HARMLS
- 2010-12-06 Listed $277,000 HARMLS
- 2003-04-22 Sold (Public Records) — Public Records
- 2003-02-12 Listing Removed — HARMLS
- 2002-10-21 Listed $295,000 HARMLS
- 1988-01-02 Sold (Public Records) — Public Records
Property tax history
+0.6%/yrLatest (2025): $7,358 · +11.1% YoY. Source: county tax records.
Cash-flow waterfall
monthlySold comps — $/sqft
last 12 mo · ≤1 miLoading sold comps…