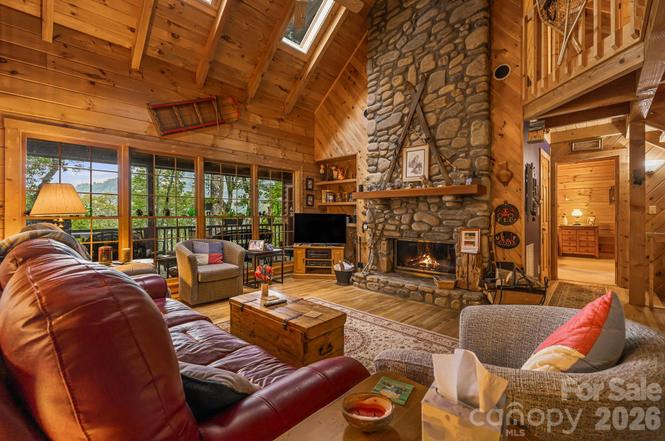
215 Goldenleaf Rd
Mars Hill, NC 28754
$729,900F
2 bd · 2.0 ba ·
2,898 sqft ·
Built 1996
· SingleFamily
· Active
· 99 DOM
Cashflow @ list (25.0% down · 7.5%)
Estimated rent
$4,500/mo
Mortgage (P&I)
−$3,828
Tax + insurance
−$466
HOA
−$243
Vac / Maint / Mgmt
−$945
Net cashflow
$-981/mo
Annual
$-11,775/yr
Cap rate
4.68%
Cash-on-cash
-5.76%
DSCR
0.74
1% rule
0.62%
Cash to close
$204,372
Investor read
- This is a 2-bed/2.0-bath single-family listed at $730k.
- At list price, monthly cash flow is $-981 ($-12k/yr) — negative.
- To cash-flow at today's rent, offer at most $557k (23.7% below list).
- To meet the 1% rule (rent ≥ 1% of price), the offer needs to be $450k (38.3% below list).
- It's been on market 99 days — a 9% lower offer ($664k) is reasonable based on typical stale-listing flexibility.
- Recommended offer: $450k (38.3% below list) — sets the bar for 1% rule.
- In year one you build about $55k of equity ($5k loan paydown + $50k appreciation (6.9% local appreciation)).
- Location reads 75/100 on livability (#49 in NC, #4,088 nationally) — a middle-class / working-renter tenant base. Strengths: housing A+, health & safety A+, crime A; Watch: amenities D, commute F.
- Yancey County Schools (rural): math 55% / reading 52% proficiency, ranked #56 of 178 in NC (top 32%) — acceptable for families but not a draw, mixed tenant base, ~2y average lease.
- Zoned schools: Mountain Heritage High (math 62% / reading 57%, grade C+, #216 of 535 statewide, top 43%, 639 students, 48% FRL) — zoned schools at 48% FRL track the district average.
- Market conditions: 248 active listings in the ZIP; 1 comparable units currently listed for rent nearby; 100 units permitted in Yancey County in 2024 (0 in 5+ unit buildings).
- Yancey County population projected at -20% by 2050 — secular population decline; favor cash flow + early exit over multi-decade hold.
- 3 sale attempts since 13y ago with the ask held roughly flat each time — persistent listings suggest the price (not the market) is what's stuck; bring a comps-based counter.
- Current owner paid $270k; list at $730k implies a 170% gain — meaningful room to come down on a strong offer.
- By year 2, paydown + projected appreciation supports a ~$89k cash-out refi (75% LTV) — recoverable capital for the next deal without selling this one.
- Cap rate 4.7% vs local median 2.3% in Mars Hill — top-decile yield for the area; either an underpriced asset or a hidden risk that comps aren't pricing in. Stress-test before assuming the spread holds.
Questions for listing agent
- What do current leases actually rent for vs. the listed asking? Can we see a recent rent roll and the last 12 months of T-12 income?
- It's been on market 99 days. Have you received any prior offers? Is the seller open to a 38% concession, seller financing, or rate buy-down credit?
- What does the HOA fee cover, when was the last increase, and are there any pending special assessments or reserve-fund shortfalls?
- Why hasn't it sold? Are there any deal-killer items the seller is aware of (foundation, flood, title, zoning, code violations)?
- Is there a deadline driving the sale (1031 exchange, divorce, estate, relocation)? That informs how much negotiation room exists.
- The area grade is low — what's the realistic commute time and amenity access for the typical tenant pool here? Any planned neighborhood developments (good or bad) we should know about?
- What's the average days-on-market for RENTAL listings here right now (not sales)? A rising rental-DOM trend means longer vacancies and softer asking-rent achievability than the comps imply.
- What's the recent tenant-quality profile in this submarket — average credit score on applications, eviction rate, late-payment / NSF rate, and stable-employment percentage? A property-management company in the area should have these aggregated.
CashFlowRE · CFR-896EBA8QF4329S
· Data 2 days ago
cashflowre.app · 2026-05-29