215 Goldenleaf Rd · Mars Hill, NC
Flood risk 1/10 · Minimal
- FEMA flood zone
- X (unshaded)
- Chance of flooding over 30 yrs
- 0.0%
- Est. flood insurance / yr
- $473 – $860
Fire risk 4/10 · Minor
- Est. fire insurance / yr
- $906 – $1,684
Heat risk 1/10 · Minimal
- Hot days now (above 87°F)
- 7 days/yr
- Hot days in 30 yrs
- 20 days/yr
Wind risk 2/10 · Minimal
- Chance of severe wind over 30 yrs
- —
Air-quality risk 3/10 · Minor
- Unhealthy air days now
- 3 days/yr
- Unhealthy air days in 30 yrs
- 3 days/yr
Risk factors via First Street. Map © Google.
Why this score? — see what drove the F grade
The composite is a weighted blend of 9 inputs, each scored 0–100. Each bar is that input's sub-score; the figure is the points it added to the 100-point composite (weight × sub-score).
- Appreciation +8.5/10.0
- Cash flow +7.3/30.0
- Schools +4.5/10.0
- Livability +3.8/5.0
- Rent growth +2.5/5.0
- Condition / age +2.5/5.0
- ARV discount +2.4/15.0
- DSCR +1.4/10.0
- 1% rule +1.2/10.0
$729,900
🖨 Deal sheet 📄 Offer letter ✓ Due diligence
Listing remarks MLS
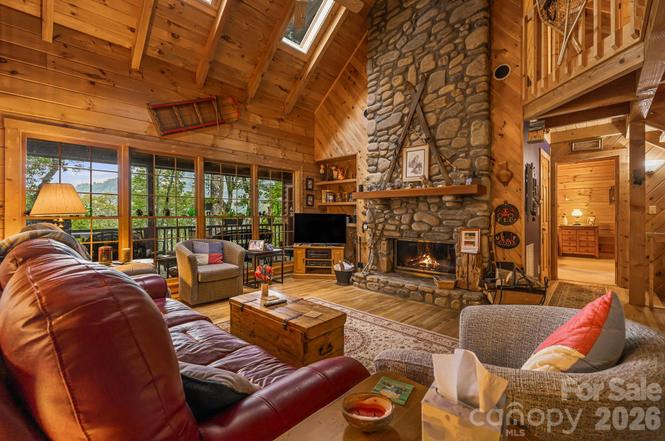
Great log cabin, fabulously maintained & landscaped. Paved road & driveway, Front porch w/waterfall, back porch, close mtn view. Cool summers! Great room & 2nd level with cathedral ceilings. Wood & drywall combinations through-out. Central sound thru-out, Wood floors on main, Lots of windows, Office/sitting area off master. Sauna in M-shw Mostly furnished, & hot tub. Great value! Seller is member of Amenity Program. NO GATE ENTRY W/O APPT
Key facts
- 0.75 acre lot
- Garage
- Community pool
Property features AI
Finance
- Other: Community amenities include fitness center, game court, gated entry, golf, outdoor pool, picnic area, playground, pond, putting green, recreation area, ski slopes, sport court, tennis courts and walking trails; Road is privately maintained and paved/asphalt; Lot elevation approximately 4000 feet; Property is subject to community restrictions (architectural review, livestock restriction, manufactured homes not allowed, short term rental allowed)
- HOA & community: Homeowners association with mandatory dues; HOA dues $195 monthly (also shown as $585 annually); Association contact available
Exterior
- Parking: Attached garage (1-car) with garage door opener; garage faces side; Basement garage door; Driveway parking
- Security: Security service
- Utilities: Community well; Septic system installed; Propane available; Electricity connected with underground power lines; Cable available; Fiber optics available; Phone connected; Underground utilities
- Home design: Single family residence; Site-built log construction; One and one-half levels; Multiple access exits
- Construction: Log construction; Basement foundation; Built as site-built
- Exterior features: Balcony; Covered porch; Deck; Front porch; Hot tub; Cul-de-sac lot; Private setting; Wooded lot; Views; Artificial waterfall
Interior
- Kitchen: Electric range; Microwave; Dishwasher
- Bedrooms: 3 bedrooms total — 1 on the main level, 1 on the upper level, 1 in the basement
- Flooring: Carpet; Tile; Vinyl; Wood
- Bathrooms: 3 full bathrooms; 1 half bathroom
- Heating & cooling: Forced air heating (propane); Ceiling fan(s)
- Interior features: Open floorplan; Split bedroom layout; Walk-in closet(s); Insulated windows; Skylights; Window treatments; French doors; Insulated exterior doors; Screen doors; Wood-burning fireplace; Finished basement with daylight, exterior entry, interior entry, storage space and walk-out access
- Laundry & utility: Washer and dryer included; Laundry room located in the basement; Electric water heater
Neighborhood map
What this means for you Summary
Snapshot
- This is a 2-bed/2.0-bath single-family listed at $730k.
Deal economics
- At list price, monthly cash flow is $-981 ($-12k/yr) — negative.
- To cash-flow at today's rent, offer at most $557k (23.7% below list).
- To meet the 1% rule (rent ≥ 1% of price), the offer needs to be $450k (38.3% below list).
- Recommended offer: $450k (38.3% below list) — sets the bar for 1% rule.
- Cap rate 4.7% vs local median 2.3% in Mars Hill — top-decile yield for the area; either an underpriced asset or a hidden risk that comps aren't pricing in. Stress-test before assuming the spread holds.
Location & tenants
- Location reads 75/100 on livability (#49 in NC, #4,088 nationally) — a middle-class / working-renter tenant base. Strengths: housing A+, health & safety A+, crime A; Watch: amenities D, commute F.
- Yancey County Schools (rural): math 55% / reading 52% proficiency, ranked #56 of 178 in NC (top 32%) — acceptable for families but not a draw, mixed tenant base, ~2y average lease.
- Zoned schools: Mountain Heritage High (math 62% / reading 57%, grade C+, #216 of 535 statewide, top 43%, 639 students, 48% FRL) — zoned schools at 48% FRL track the district average.
- Market conditions: 248 active listings in the ZIP; 1 comparable units currently listed for rent nearby; 100 units permitted in Yancey County in 2024 (0 in 5+ unit buildings).
Forward outlook
- In year one you build about $55k of equity ($5k loan paydown + $50k appreciation (6.9% local appreciation)).
- Yancey County population projected at -20% by 2050 — secular population decline; favor cash flow + early exit over multi-decade hold.
- By year 2, paydown + projected appreciation supports a ~$89k cash-out refi (75% LTV) — recoverable capital for the next deal without selling this one.
Negotiation context
- It's been on market 99 days — a 9% lower offer ($664k) is reasonable based on typical stale-listing flexibility.
- 3 sale attempts since 13y ago with the ask held roughly flat each time — persistent listings suggest the price (not the market) is what's stuck; bring a comps-based counter.
- Current owner paid $270k; list at $730k implies a 170% gain — meaningful room to come down on a strong offer.
Questions for the listing agent
- What do current leases actually rent for vs. the listed asking? Can we see a recent rent roll and the last 12 months of T-12 income?
- It's been on market 99 days. Have you received any prior offers? Is the seller open to a 38% concession, seller financing, or rate buy-down credit?
- What does the HOA fee cover, when was the last increase, and are there any pending special assessments or reserve-fund shortfalls?
- Why hasn't it sold? Are there any deal-killer items the seller is aware of (foundation, flood, title, zoning, code violations)?
- Is there a deadline driving the sale (1031 exchange, divorce, estate, relocation)? That informs how much negotiation room exists.
- The area grade is low — what's the realistic commute time and amenity access for the typical tenant pool here? Any planned neighborhood developments (good or bad) we should know about?
- What's the average days-on-market for RENTAL listings here right now (not sales)? A rising rental-DOM trend means longer vacancies and softer asking-rent achievability than the comps imply.
- What's the recent tenant-quality profile in this submarket — average credit score on applications, eviction rate, late-payment / NSF rate, and stable-employment percentage? A property-management company in the area should have these aggregated.
- How much new for-sale + rental construction is in the pipeline within 1–3 miles? Heavy new supply typically softens prices + rents 12–24 months out; constrained supply supports both.
Investment metrics
- 1% rule
- 0.62% ✗
- Cap rate
- 4.68%
- Cash-on-cash
- -5.76%
- DSCR
- 0.74
- GRM
- 13.5
CMA / ARV
- ARV (on-the-fly)
- $654,948
- Comps found
- 3
Show comp detail 3 sales within ~0.75 mi
| Address | Dist | Beds/Ba | Sqft | Sold | Price | $/sf | Match |
|---|---|---|---|---|---|---|---|
| 14 Zebulon Ln | 0.18mi | 3/3.5 (+1) | 3,028 (+4%) | 4mo | $685,000 | $226 | 70 |
| 3182 El Miner Dr | 0.57mi | 3/2.5 (+1) | 2,694 (-7%) | 18mo | $699,000 | $259 | 40 |
| 101 Oakridge Ct Unit 701/700 | 0.72mi | 3/2.0 (+1) | 2,464 (-15%) | 14mo | $450,000 | $183 | 25 |
Match score weights: distance 35% · size 25% · config 20% · recency 20%. Top-matched comps best support the ARV.
Projected returns pro-forma
6.91% appreciation · 3.0% rent growth · sell at horizon
- IRR
- 13.0%
- Equity multiple
- 1.92×
- Total profit
- $187,882
- Equity at exit
- $501,274
- IRR
- 13.4%
- Equity multiple
- 3.90×
- Total profit
- $592,824
- Equity at exit
- $948,122
Cash invested: $204,372 (down + closing). Projections, not guarantees.
Landlord ↔ Tenant lean methodology
- Overall (STATE)
- 85 Strongly Landlord-Friendly
- State North Carolina
- 85 Strongly Landlord-Friendly · R+3
- County
- — inherits STATE
- City
- — inherits STATE
ZIP-level market 28754
- Home prices YoY
- 2.3%
- Active inventory
- 248
- Price-to-rent
- 13.5×
Monthly cashflow live
- Estimated rent
- $4,500 medium interval (Pro) →
- Mortgage (P&I)
- −$3,828
- Tax from tax record
- −$161 /mo · $1,937/yr
- Insurance
- −$304
- HOA
- −$243
- Vacancy / Maint / Mgmt
- −$945
- Net cashflow
- $-981
Break-even live
UW: 25.0% down · 7.5% · 30yr · 1.5% tax · 5.0% vac · 8.0% maint · 8.0% mgmt
Financing live
Cash to close
- Down payment
- $182,475
- Closing costs
- $21,897
- Reserves months
- —
- Total cash needed
- —
Loan-product check · same deal, 3 products live
Conventional
25% down · 7.5% · 30yr
- Down + closing
- —
- Monthly P&I
- —
- Monthly cashflow
- —
- DSCR
- —
- Eligible?
- —
Personal DTI + credit; lowest rate.
DSCR
20% down · 8.5% · 30yr
- Down + closing
- —
- Monthly P&I
- —
- Monthly cashflow
- —
- DSCR
- —
- Eligible?
- —
No personal income docs; deal must DSCR.
Hard money
10% down · 12.0% · 12mo
- Down + closing
- —
- Monthly P&I
- —
- Monthly cashflow
- —
- DSCR
- —
- Eligible?
- —
Short-term bridge; refi at stabilization.
Rent comps 1 comps
| Address | Beds | Baths | Sqft | Rent | $/sqft | DOM | Units | Dist |
|---|---|---|---|---|---|---|---|---|
| 2535 El Miner Dr Mars Hill, NC | 3.0 | 3.0 | 2850 | $4,500 | $1.58 | 21d | 1 | 1.08mi |
HOA detail
- Monthly dues
- $243 · $2,916/yr
- Likely covers
- water
Listing history 24 events
-
2026-06-18days on market $729,900 Active 99 DOM
-
2026-06-17days on market $729,900 Active 98 DOM
-
2026-06-16days on market $729,900 Active 97 DOM
-
2026-06-15days on market $729,900 Active 96 DOM
-
2026-06-14days on market $729,900 Active 94 DOM
-
2026-06-13days on market $729,900 Active 93 DOM
-
2026-06-10days on market $729,900 Active 91 DOM
-
2026-06-09days on market $729,900 Active 90 DOM
-
2026-06-08days on market $729,900 Active 89 DOM
-
2026-06-07days on market $729,900 Active 88 DOM
-
2026-06-03days on market $729,900 Active 84 DOM
-
2026-06-02days on market $729,900 Active 83 DOM
-
2026-06-01days on market $729,900 Active 82 DOM
-
2026-05-31days on market $729,900 Active 81 DOM
-
2026-05-30days on market $729,900 Active 80 DOM
-
2026-03-11$749,900 Active
-
2026-01-15price $749,900
-
2025-11-22price $786,000
-
2025-09-11$799,900 Active
-
2013-10-30soldstatus $270,000 462-char remark
Show marketing remark (462 chars)
Great log cabin, fabulously maintained & landscaped. Paved road & driveway, Front porch w/waterfall, back porch, close mtn view. Cool summers! Great room & 2nd level with cathedral ceilings. Wood & drywall combinations through-out. Central sound thru-out, Wood floors on main, Lots of windows, Office/sitting area off master. Sauna in M-shw Mostly furnished, & hot tub. Great value! Seller is member of Amenity Program. NO GATE ENTRY W/O APPT
-
2013-10-29soldstatus $270,000
-
2013-10-03historical 462-char remark
Show marketing remark (462 chars)
Great log cabin, fabulously maintained & landscaped. Paved road & driveway, Front porch w/waterfall, back porch, close mtn view. Cool summers! Great room & 2nd level with cathedral ceilings. Wood & drywall combinations through-out. Central sound thru-out, Wood floors on main, Lots of windows, Office/sitting area off master. Sauna in M-shw Mostly furnished, & hot tub. Great value! Seller is member of Amenity Program. NO GATE ENTRY W/O APPT
-
2013-06-24$294,000 462-char remark
Show marketing remark (462 chars)
Great log cabin, fabulously maintained & landscaped. Paved road & driveway, Front porch w/waterfall, back porch, close mtn view. Cool summers! Great room & 2nd level with cathedral ceilings. Wood & drywall combinations through-out. Central sound thru-out, Wood floors on main, Lots of windows, Office/sitting area off master. Sauna in M-shw Mostly furnished, & hot tub. Great value! Seller is member of Amenity Program. NO GATE ENTRY W/O APPT
ⓘ Source: listings_history table (triggers on properties + properties_extension) + one-shot
backfill from property_details.listing_events for pre-trigger history.
Tax reassessment forecast NC · Resets to sale price
- Current annual tax
- $1,937 · $161/mo
- Projected year-2 tax
- $5,985 · $499/mo
- Expected delta
- +$4,048/yr (+$337/mo · 209.0%)
ⓘ Screening estimate from a state-policy table — verify with the county assessor before closing.
Climate risk First Street
- Flood 1/10 Low FEMA zone X (unshaded) · 0% chance over 30 yrs
- Wildfire 4/10 Moderate
- Heat 1/10 Low 7 d/yr ≥87°F today · 20 d/yr by 30 yrs out
- Wind 2/10 Low
- Air quality 3/10 Moderate 3 unhealthy d/yr today · 3 by 30 yrs out
Nearby sold comps map
Loading sold comps map…
Walkable amenities ~0.75 mi
Loading nearby amenities…
Taxation est. · year 1
- Rental income
- $54,000
- − Mortgage interest
- −$40,886
- − Property taxes
- −$1,937
- − Insurance
- −$3,650
- − Repairs & maintenance
- −$4,320
- − Management
- −$4,320
- − HOA
- −$2,916
- − Depreciation
- −$21,233
- Taxable loss
- −$25,262
- Est. tax savings @ 24.0%
- +$6,063
- After-tax cash flow
- $-5,712/yr
For passive investors: Depreciation is non-cash, so a rental often shows a tax loss while cash-flowing — sheltering income. Rental losses are passive: they offset passive income freely, and up to $25,000/yr can offset ordinary (W-2) income if you actively participate and your MAGI is under $100k (phasing out to $0 by $150k); unused losses carry forward. On sale, claimed depreciation is recaptured at up to 25%, and gains may owe capital-gains tax (a 1031 exchange can defer both). Figures are a year-1 estimate at your 24.0% rate — not tax advice; consult a CPA.
Schools (NCES district)
- District
- Yancey County Schools
- NCES district ID
- 3705070
- Math proficiency
- 55% ▲ 6.00%
- Reading proficiency
- 52% ▲ 5.00%
- Median HH income
- $37,576
- Composite
- 44.52/100
- National rank
- #2795
- State rank
- #56 of 178 in NC
Livability — Mars Hill
- Score
- 75/100
- State rank
- #49
- US rank
- #4088
Category grades
Schools grade is shown separately in the Schools card above.
Census & demographics
- Population (ZIP)
- 9,897
Population outlook (Yancey County) Hauer SSP2
- Today (2025)
- 16,797 people
- By 2030
- 16,215 · -3.5%
- By 2040
- 14,830 · -11.7%
- By 2050
- 13,469 · -19.8%
- By 2075
- 10,583 · -37.0%
- By 2100
- 7,497 · -55.4%
Race, ethnicity, and origin ACS 2023
- Neighborhood character
- Predominantly White (91%)
- Race & ethnicity
- White 91% Two or more races 6% Hispanic / Latino 5% Black 2%
- Hispanic origin (detail)
- Mexican 4%
- Common ancestry
- Serbian 6% Slovak 4% Lithuanian 3%
- Foreign-born
- 2% · Canada
- Languages at home
- 98% English-only · Spanish 2%
Political lean MEDSL · Yancey
- 2024 margin
- Solid R (+34.4) · D 32.3% · R 66.8%
- 2008→2024 swing
- -28.7pp toward R · 2008: -5.8pp · 2024: -34.4pp
- All cycles
- 2024: R+34.4 2020: R+33.7 2016: R+32.5 2012: R+13.9 2008: R+5.8
Not yet ingested
- Civics
- —
Market trends
- HPI YoY
- ▲ 6.91%
- Current HPI
- 304.2399
- Rent YoY
- —
- Metro
- —
- State GDP YoY
- ▲ 3.28%
- F500 in state
- 26
Industry mix (Fortune 500 HQ in NC)
| Industry | F500 HQs | Revenue |
|---|---|---|
| Financial Services | 2 | $213B |
|
||
| Retail | 2 | $95B |
|
||
| Industrial Conglomerate | 1 | $38B |
|
||
| Metals / Steel | 1 | $35B |
|
||
| Utilities | 1 | $30B |
|
||
| Industrial Machinery | 1 | $19B |
|
||
Price history
+155.1% since first listed9 events — show timeline
- 2026-03-11 Listed $749,900 CANOPYMLS as Distributed by MLS Grid
- 2026-01-15 Price Changed $749,900 CANOPYMLS as Distributed by MLS Grid
- 2025-11-22 Price Changed $786,000 CANOPYMLS as Distributed by MLS Grid
- 2025-09-11 Listed $799,900 CANOPYMLS as Distributed by MLS Grid
- 2013-10-30 Sold (MLS) $270,000 NCMMLS
- 2013-10-30 Sold (MLS) $270,000 CANOPYMLS as Distributed by MLS Grid
- 2013-10-29 Sold (Public Records) $270,000 Public Records
- 2013-10-03 Delisted — CANOPYMLS as Distributed by MLS Grid
- 2013-06-24 Listed $294,000 CANOPYMLS as Distributed by MLS Grid
Property tax history
+2.2%/yrLatest (2025): $1,937 · +0.0% YoY. Source: county tax records.
Cash-flow waterfall
monthlySold comps — $/sqft
last 12 mo · ≤1 miLoading sold comps…