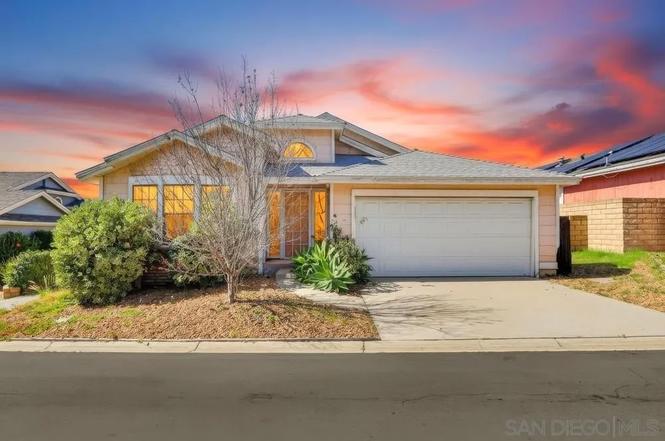
13691 Gavina #609
Los Angeles, CA 91342
$160,000B+
3 bd · 2.0 ba ·
1,624 sqft ·
Built 1989
· Manufactured
· Pending
· 7 DOM
Cashflow @ list (25.0% down · 7.5%)
Estimated rent
$3,860/mo
Mortgage (P&I)
−$839
Tax + insurance
−$108
HOA
−$0
Vac / Maint / Mgmt
−$811
Net cashflow
$2,102/mo
Annual
$25,224/yr
Cap rate
22.06%
Cash-on-cash
56.30%
DSCR
3.51
1% rule
2.41%
Cash to close
$44,800
Investor read
- This is a 3-bed/2.0-bath manufactured listed at $160k.
- At list price, monthly cash flow is $2k ($25k/yr) — positive.
- The deal already cash-flows at list — no discount required.
- Meets the 1% rule at list price ($4k rent vs $160k).
- Only 7 days on market — expect competitive offers; lowballing is unlikely to land.
- Local home prices are declining (-3.0%/yr); year-one equity from $1k of loan paydown is wiped out by about $5k of value loss. Plan a longer hold.
- Location reads 68/100 on livability (#273 in CA) — a middle-class / working-renter tenant base. Strengths: amenities A+, commute A+, employment B; Watch: health & safety C-, crime F, cost of living F.
- Los Angeles Unified (urban): math 29% / reading 54% proficiency, ranked #223 of 517 in CA (top 43%) — families likely to look elsewhere, expect single-tenant / working-renter base with shorter leases; 67% free/reduced lunch — lower-income household profile, screen leases tightly.
- Zoned schools: Harding Street Elementary (371 students, 66% FRL); San Fernando Middle (524 students, 97% FRL); San Fernando Senior High (math 20% / reading 51%, grade F, #609 of 1,170 statewide, top 52%, 1,745 students, 94% FRL) — zoned schools average 85% FRL vs 67% district-wide (18 pts higher); higher-poverty schools than district average — tighter screening recommended.
- Market conditions: Rents flat; 183 active listings in the ZIP; 6 comparable units currently listed for rent nearby; rentals at typical pace (median 17d on market — plan ~3-4 weeks tenant-placement turnaround); solid renter incomes; 19,697 units permitted in Los Angeles County in 2024 (9,426 in 5+ unit buildings).
- Los Angeles County population projected at +9% by 2050 — modest demand growth; plan on rents tracking national, not racing it.
- At projected returns (-3.0% appreciation + 0.0% rent growth), your $45k cash investment doubles in ~3 years — after that, you're playing with house money.
- Climate carrying-cost: severe wildfire risk; extreme-heat days projected 9→25/yr by 2055 (HVAC capex compounding) — expect insurance premiums to compound above CPI over the hold.
- Cap rate 22.1% vs local median 2.1% in Los Angeles — top-decile yield for the area; either an underpriced asset or a hidden risk that comps aren't pricing in. Stress-test before assuming the spread holds.
- At $3,860/mo this rent would consume 47% of the median local household income ($98k/yr) (locally 2559% of renters already pay >50% of income on rent) — very limited rent-growth headroom before tenants either downsize or default.
Questions for listing agent
- Is there a deadline driving the sale (1031 exchange, divorce, estate, relocation)? That informs how much negotiation room exists.
- Schools are D-rated, which usually means shorter tenancies and higher turnover. Who's the typical renter profile here, and what's been the actual vacancy rate?
- Crime grade is F in this area — have there been break-ins, vandalism, or insurance claims at this property in the last 3 years? What carrier currently insures it and at what premium?
- What's the average days-on-market for RENTAL listings here right now (not sales)? A rising rental-DOM trend means longer vacancies and softer asking-rent achievability than the comps imply.
- What's the recent tenant-quality profile in this submarket — average credit score on applications, eviction rate, late-payment / NSF rate, and stable-employment percentage? A property-management company in the area should have these aggregated.
- How much new for-sale + rental construction is in the pipeline within 1–3 miles? Heavy new supply typically softens prices + rents 12–24 months out; constrained supply supports both.
CashFlowRE · CFR-8A4W7F9XW31YZK
· Data 4 weeks ago
cashflowre.app · 2026-05-29