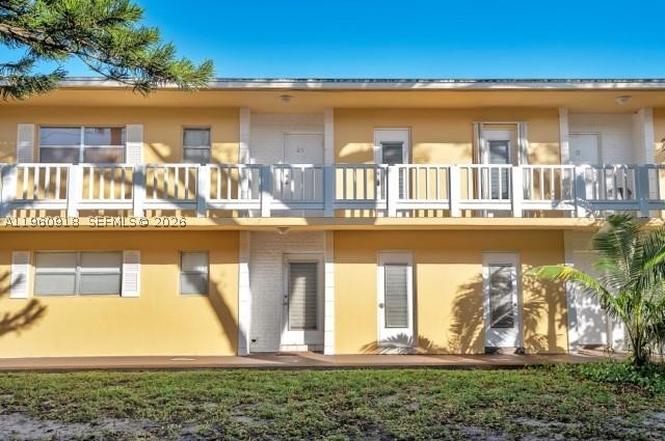
550 SE 2nd Ave Unit G25
Deerfield Beach, FL 33441
$175,000D-
2 bd · 1.0 ba ·
840 sqft ·
Built 1978
· Condo
· Active
· 132 DOM
Cashflow @ list (25.0% down · 7.5%)
Estimated rent
$2,074/mo
Mortgage (P&I)
−$918
Tax + insurance
−$363
HOA
−$482
Vac / Maint / Mgmt
−$436
Net cashflow
$-124/mo
Annual
$-1,494/yr
Cap rate
5.44%
Cash-on-cash
-3.05%
DSCR
0.86
1% rule
1.19%
Cash to close
$49,000
Investor read
- This is a 2-bed/1.0-bath condo listed at $175k.
- At list price, monthly cash flow is $-124 ($-1k/yr) — negative.
- To cash-flow at today's rent, offer at most $153k (12.6% below list).
- Meets the 1% rule at list price ($2k rent vs $175k).
- It's been on market 132 days — a 12% lower offer ($154k) is reasonable based on typical stale-listing flexibility.
- Recommended offer: $153k (12.6% below list) — sets the bar for cash-flow.
- Local home prices are declining (-3.0%/yr); year-one equity from $1k of loan paydown is wiped out by about $5k of value loss. Plan a longer hold.
- Location reads 75/100 on livability (#250 in FL, #3,970 nationally) — a middle-class / working-renter tenant base. Strengths: housing A+, health & safety A+, cost of living A; Watch: schools D-, amenities D-, employment D-.
- Broward (suburban): math 42% / reading 53% proficiency, ranked #46 of 73 in FL (top 63%) — families likely to look elsewhere, expect single-tenant / working-renter base with shorter leases.
- Watch-outs: HOA is 23% of rent.
- Market conditions: Rents rising (+2.2%/yr); 297 active listings in the ZIP; 40 comparable units currently listed for rent nearby; rentals at typical pace (median 15d on market — plan ~3-4 weeks tenant-placement turnaround); 2,111 units permitted in Broward County in 2024 (1,265 in 5+ unit buildings).
- Broward County population projected at +34% by 2050 — long-run rental-demand tailwind backs the buy-and-hold thesis.
- 5 sale attempts since 23y ago with the ask held roughly flat each time — persistent listings suggest the price (not the market) is what's stuck; bring a comps-based counter.
- Current owner paid $118k; 48% above their basis — modest negotiation headroom, anchor on the comps not their cost.
- Climate carrying-cost: severe wind risk, 99% chance of damaging wind over 30y; extreme-heat days projected 7→26/yr by 2055 (HVAC capex compounding) — expect insurance premiums to compound above CPI over the hold.
- Cap rate 5.4% vs local median 4.2% in Deerfield Beach — meaningfully above typical; check what's discounted (condition, days-on-market, listing class) to confirm the premium yield is real.
- This rent runs 42% of the median local income ($59k/yr) — at the standard rent-burdened threshold; future hikes will face affordability resistance.
Questions for listing agent
- What do current leases actually rent for vs. the listed asking? Can we see a recent rent roll and the last 12 months of T-12 income?
- It's been on market 132 days. Have you received any prior offers? Is the seller open to a 13% concession, seller financing, or rate buy-down credit?
- Built in 1978 — when were the roof, HVAC, electrical panel, plumbing, and water heater last replaced?
- What does the HOA fee cover, when was the last increase, and are there any pending special assessments or reserve-fund shortfalls?
- Any open or pending special assessments — roof, HVAC, plumbing, elevator, façade? What's the per-unit balance and payoff schedule, and is the seller paying it off at close or rolling it to the buyer?
- Why hasn't it sold? Are there any deal-killer items the seller is aware of (foundation, flood, title, zoning, code violations)?
- Is there a deadline driving the sale (1031 exchange, divorce, estate, relocation)? That informs how much negotiation room exists.
- Schools are D-rated, which usually means shorter tenancies and higher turnover. Who's the typical renter profile here, and what's been the actual vacancy rate?
CashFlowRE · CFR-8AV03M6MSBJX2K
· Data 2 days ago
cashflowre.app · 2026-05-29