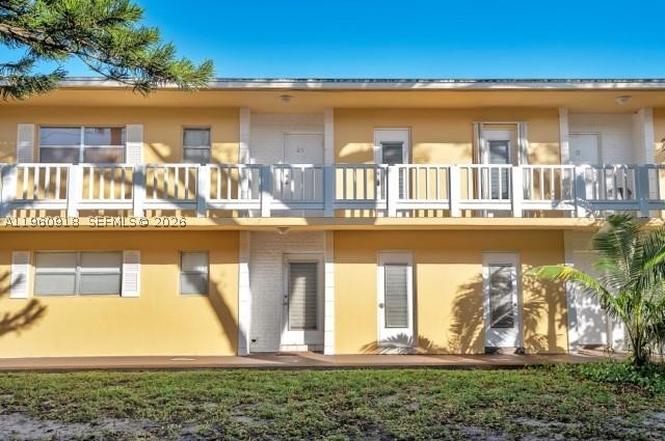
550 SE 2nd Ave Unit G25 · Deerfield Beach, FL
Flood risk 3/10 · Minor
- FEMA flood zone
- X (unshaded)
- Chance of flooding over 30 yrs
- 0.1%
- Est. flood insurance / yr
- $507 – $1,088
Fire risk 1/10 · Minimal
- Est. fire insurance / yr
- $947 – $1,759
Heat risk 10/10 · Severe
- Hot days now (above 106°F)
- 7 days/yr
- Hot days in 30 yrs
- 26 days/yr
Wind risk 10/10 · Severe
- Chance of severe wind over 30 yrs
- 99.0%
Air-quality risk 2/10 · Minimal
- Unhealthy air days now
- 1 days/yr
- Unhealthy air days in 30 yrs
- 3 days/yr
Risk factors via First Street. Map © Google.
Why this score? — see what drove the D- grade
The composite is a weighted blend of 9 inputs, each scored 0–100. Each bar is that input's sub-score; the figure is the points it added to the 100-point composite (weight × sub-score).
- Cash flow +9.4/30.0
- ARV discount +7.5/15.0
- 1% rule +6.9/10.0
- Schools +4.1/10.0
- Livability +3.8/5.0
- Rent growth +3.0/5.0
- DSCR +2.6/10.0
- Condition / age +2.5/5.0
- Appreciation +0.0/10.0
$175,000
🖨 Deal sheet 📄 Offer letter ✓ Due diligence
Listing remarks MLS
Perfect apartment for investors or to live. Easy to rent! Tenant occupied but Tenant is leaving January 13th 2020.
Key facts
- Upgraded kitchen
- Freshly painted
- $482 HOA
Tags
Property features AI
Finance
- Financial info: Pets allowed with size limit (more than 20 lbs allowed)
- HOA & community: Monthly association fee; Association fee covers insurance, grounds maintenance, pool(s), sewer, trash and water; Community pool
Exterior
- Parking: One parking space
- Utilities: Water included in association fee; Sewer included in association fee; Trash service included in association fee; Power and other utilities available (central systems for heating/cooling)
- Home design: Attached property; 2-story; Second-floor entry
- Construction: Block construction; Resale property
- Exterior features: Association pool; No additional exterior features listed
Interior
- Kitchen: Electric range; Microwave; Dishwasher; Refrigerator
- Flooring: Tile
- Bathrooms: 1 full bathroom
- Heating & cooling: Central heating; Central air conditioning
- Interior features: Second-floor entry; Blinds
- Laundry & utility: Washer; Dryer
Neighborhood map
What this means for you Summary
Snapshot
- This is a 2-bed/1.0-bath condo listed at $175k.
Deal economics
- At list price, monthly cash flow is $-124 ($-1k/yr) — negative.
- To cash-flow at today's rent, offer at most $153k (12.6% below list).
- Meets the 1% rule at list price ($2k rent vs $175k).
- Recommended offer: $153k (12.6% below list) — sets the bar for cash-flow.
- Cap rate 5.4% vs local median 4.2% in Deerfield Beach — meaningfully above typical; check what's discounted (condition, days-on-market, listing class) to confirm the premium yield is real.
Location & tenants
- Location reads 75/100 on livability (#250 in FL, #3,970 nationally) — a middle-class / working-renter tenant base. Strengths: housing A+, health & safety A+, cost of living A; Watch: schools D-, amenities D-, employment D-.
- Broward (suburban): math 42% / reading 53% proficiency, ranked #46 of 73 in FL (top 63%) — families likely to look elsewhere, expect single-tenant / working-renter base with shorter leases.
- Market conditions: Rents rising (+2.2%/yr); 297 active listings in the ZIP; 40 comparable units currently listed for rent nearby; rentals at typical pace (median 15d on market — plan ~3-4 weeks tenant-placement turnaround); 2,111 units permitted in Broward County in 2024 (1,265 in 5+ unit buildings).
- This rent runs 42% of the median local income ($59k/yr) — at the standard rent-burdened threshold; future hikes will face affordability resistance.
Forward outlook
- Local home prices are declining (-3.0%/yr); year-one equity from $1k of loan paydown is wiped out by about $5k of value loss. Plan a longer hold.
- Broward County population projected at +34% by 2050 — long-run rental-demand tailwind backs the buy-and-hold thesis.
Negotiation context
- It's been on market 132 days — a 12% lower offer ($154k) is reasonable based on typical stale-listing flexibility.
- 5 sale attempts since 23y ago with the ask held roughly flat each time — persistent listings suggest the price (not the market) is what's stuck; bring a comps-based counter.
- Current owner paid $118k; 48% above their basis — modest negotiation headroom, anchor on the comps not their cost.
Risks & watch-outs
- Watch-outs: HOA is 23% of rent.
- Climate carrying-cost: severe wind risk, 99% chance of damaging wind over 30y; extreme-heat days projected 7→26/yr by 2055 (HVAC capex compounding) — expect insurance premiums to compound above CPI over the hold.
Questions for the listing agent
- What do current leases actually rent for vs. the listed asking? Can we see a recent rent roll and the last 12 months of T-12 income?
- It's been on market 132 days. Have you received any prior offers? Is the seller open to a 13% concession, seller financing, or rate buy-down credit?
- Built in 1978 — when were the roof, HVAC, electrical panel, plumbing, and water heater last replaced?
- What does the HOA fee cover, when was the last increase, and are there any pending special assessments or reserve-fund shortfalls?
- Any open or pending special assessments — roof, HVAC, plumbing, elevator, façade? What's the per-unit balance and payoff schedule, and is the seller paying it off at close or rolling it to the buyer?
- Why hasn't it sold? Are there any deal-killer items the seller is aware of (foundation, flood, title, zoning, code violations)?
- Is there a deadline driving the sale (1031 exchange, divorce, estate, relocation)? That informs how much negotiation room exists.
- Schools are D-rated, which usually means shorter tenancies and higher turnover. Who's the typical renter profile here, and what's been the actual vacancy rate?
- The area grade is low — what's the realistic commute time and amenity access for the typical tenant pool here? Any planned neighborhood developments (good or bad) we should know about?
- What's the average days-on-market for RENTAL listings here right now (not sales)? A rising rental-DOM trend means longer vacancies and softer asking-rent achievability than the comps imply.
- What's the recent tenant-quality profile in this submarket — average credit score on applications, eviction rate, late-payment / NSF rate, and stable-employment percentage? A property-management company in the area should have these aggregated.
- How much new apartment / multifamily construction is in the pipeline within 1–3 miles? Heavy new supply (>2% of stock underway) typically softens rents 12–24 months out; light construction supports rent growth.
Investment metrics
- 1% rule
- 1.19% ✓
- Cap rate
- 5.44%
- Cash-on-cash
- -3.05%
- DSCR
- 0.86
- GRM
- 7.0
CMA / ARV
No comps found within radius.
Projected returns pro-forma
-3.0% appreciation · 2.17% rent growth · sell at horizon
- IRR
- -22.5%
- Equity multiple
- 0.23×
- Total profit
- $-37,632
- Equity at exit
- $26,093
- IRR
- -19.4%
- Equity multiple
- 0.01×
- Total profit
- $-48,402
- Equity at exit
- $15,131
Cash invested: $49,000 (down + closing). Projections, not guarantees.
Landlord ↔ Tenant lean methodology
- Overall (STATE)
- 87 Strongly Landlord-Friendly
- State Florida
- 87 Strongly Landlord-Friendly · R+3
- County
- — inherits STATE
- City
- — inherits STATE
ZIP-level market 33441
- Rents YoY
- 2.2%
- Active inventory
- 297
- Price-to-rent
- 7.0×
Monthly cashflow live
- Estimated rent
- $2,074 high interval (Pro) →
- Mortgage (P&I)
- −$918
- Tax from tax record
- −$290 /mo · $3,483/yr
- Insurance
- −$73
- HOA
- −$482
- Vacancy / Maint / Mgmt
- −$436
- Net cashflow
- $-124
Break-even live
UW: 25.0% down · 7.5% · 30yr · 1.5% tax · 5.0% vac · 8.0% maint · 8.0% mgmt
Financing live
Cash to close
- Down payment
- $43,750
- Closing costs
- $5,250
- Reserves months
- —
- Total cash needed
- —
Loan-product check · same deal, 3 products live
Conventional
25% down · 7.5% · 30yr
- Down + closing
- —
- Monthly P&I
- —
- Monthly cashflow
- —
- DSCR
- —
- Eligible?
- —
Personal DTI + credit; lowest rate.
DSCR
20% down · 8.5% · 30yr
- Down + closing
- —
- Monthly P&I
- —
- Monthly cashflow
- —
- DSCR
- —
- Eligible?
- —
No personal income docs; deal must DSCR.
Hard money
10% down · 12.0% · 12mo
- Down + closing
- —
- Monthly P&I
- —
- Monthly cashflow
- —
- DSCR
- —
- Eligible?
- —
Short-term bridge; refi at stabilization.
Rent comps 40 comps
| Address | Beds | Baths | Sqft | Rent | $/sqft | DOM | Units | Dist |
|---|---|---|---|---|---|---|---|---|
| 540 SE 2nd Ave Unit J4 Deerfield Beach, FL | 1.0 | 1.0 | 650 | $1,500 | $2.31 | 7d | 1 | 0.04mi |
| 550 SE 2nd Ave Unit G3 Deerfield Beach, FL | 1.0 | 1.0 | 650 | $1,550 | $2.38 | 7d | 1 | 0.04mi |
| 610 SE 2nd Ave Unit L8 Deerfield Beach, FL | 2.0 | 1.0 | 840 | $1,725 | $2.05 | 7d | 1 | 0.05mi |
| 610 SE 2nd Ave Unit L8 Deerfield Beach, FL | 2.0 | 1.0 | 840 | $1,680 | $2.00 | 5d | 1 | 0.05mi |
| 560 SE 2nd Ave Deerfield Beach, FL | 2.0 | 1.0 | 840 | $1,750 | $2.08 | 16d | 1 | 0.05mi |
| 530 SE 2nd Ave Unit F24 Deerfield Beach, FL | 2.0 | 1.0 | 840 | $1,800 | $2.14 | 22d | 1 | 0.05mi |
| 500 SE 2nd Ave #22 Deerfield Beach, FL | 2.0 | 1.0 | 840 | $1,850 | $2.20 | 18d | 1 | 0.06mi |
| 700 SE 2nd Ave #315 Deerfield Beach, FL | 2.0 | 2.0 | 920 | $2,000 | $2.17 | 20d | 1 | 0.17mi |
| 1100 SE 4th Ave Deerfield Beach, FL | 2.0 | 1.5–2.0 | 1080 | $1,900 | $1.76 | 24d | 2 | 0.17mi |
| 760 SE 2nd Ave Unit C207 Deerfield Beach, FL | 1.0 | 1.5 | 765 | $1,700 | $2.22 | 24d | 1 | 0.26mi |
| 760 SE 2nd Ave Unit D112 Deerfield Beach, FL | 1.0 | 1.5 | 765 | $1,700 | $2.22 | 2d | 1 | 0.26mi |
| 770 SE 2nd Ave Deerfield Beach, FL | 1.0–2.0 | 1.5–2.0 | 855 | $2,350 | $2.75 | 7d | 3 | 0.27mi |
| 770 SE 2nd Ave Deerfield Beach, FL | 1.0–2.0 | 1.5–2.0 | 855 | $2,350 | $2.75 | 4d | 3 | 0.27mi |
| 770 SE 2nd Ave Deerfield Beach, FL | 1.0–2.0 | 1.5–2.0 | 855 | $2,350 | $2.75 | 10d | 2 | 0.27mi |
| 733 SE 1st Way #109 Deerfield Beach, FL | 2.0 | 2.0 | 1033 | $2,800 | $2.71 | 5d | 1 | 0.27mi |
| 733 SE 1st Way #109 Deerfield Beach, FL | 2.0 | 2.0 | 1033 | $2,850 | $2.76 | 14d | 1 | 0.27mi |
| 495 SE 8th St #237 Deerfield Beach, FL | 2.0 | 2.0 | 1100 | $1,875 | $1.70 | 24d | 1 | 0.28mi |
| 737 SE 1st Way #302 Deerfield Beach, FL | 2.0 | 2.0 | 1070 | $2,100 | $1.96 | 24d | 1 | 0.30mi |
| 737 SE 1st Way Deerfield Beach, FL | 1.0–2.0 | 1.5–2.0 | 885 | $2,100 | $2.37 | 7d | 2 | 0.30mi |
| 791 SE 1st Way #74 Deerfield Beach, FL | 2.0 | 2.5 | 1070 | $2,300 | $2.15 | 17d | 1 | 0.30mi |
| 285 SE 10th St Unit 8A Deerfield Beach, FL | 2.0 | 2.0 | 972 | $2,400 | $2.47 | 20d | 1 | 0.30mi |
| 555 SE 8th St #151 Deerfield Beach, FL | 1.0 | 1.5 | 925 | $1,800 | $1.95 | 12d | 1 | 0.31mi |
| 899 SE 2nd Ave #218 Deerfield Beach, FL | 1.0 | 1.5 | 775 | $1,750 | $2.26 | 15d | 1 | 0.33mi |
| 899 SE 2nd Ave #218 Deerfield Beach, FL | 1.0 | 1.5 | 775 | $1,750 | $2.26 | 16d | 1 | 0.33mi |
| 265 SE 10th St Unit 1C Deerfield Beach, FL | 2.0 | 2.0 | 1012 | $2,500 | $2.47 | 4d | 1 | 0.34mi |
| 265 SE 10th St Unit 1C Deerfield Beach, FL | 2.0 | 2.0 | 1012 | $2,500 | $2.47 | 4d | 1 | 0.34mi |
| 959 SE 2nd Ave #204 Deerfield Beach, FL | 2.0 | 2.0 | 1000 | $2,000 | $2.00 | 14d | 1 | 0.36mi |
| 959 SE 2nd Ave #101 Deerfield Beach, FL | 1.0 | 1.5 | 800 | $1,695 | $2.12 | 2d | 1 | 0.36mi |
| 959 SE 2nd Ave Deerfield Beach, FL | 1.0–2.0 | 1.5–2.0 | 900 | $2,000 | $2.22 | 16d | 2 | 0.38mi |
| 810 SE 7th St Unit A307 Deerfield Beach, FL | 1.0 | 1.5 | 800 | $1,200 | $1.50 | 24d | 1 | 0.40mi |
| 367 S Federal Hwy Deerfield Beach, FL | 2.0 | 2.0 | 969 | $2,300 | $2.37 | 7d | 2 | 0.42mi |
| 367 S Federal Hwy Deerfield Beach, FL | 2.0 | 2.0 | 969 | $2,300 | $2.37 | 18d | 2 | 0.42mi |
| 367 S Federal Hwy Unit C221 Deerfield Beach, FL | 2.0 | 2.0 | 954 | $2,450 | $2.57 | 24d | 1 | 0.42mi |
| 777-779 S Federal Hwy Ph 16 Pompano Beach, FL | 2.0 | 1.5 | 911 | $1,995 | $2.19 | 24d | 1 | 0.45mi |
| 400 SE 10th St Deerfield Beach, FL | 2.0 | 2.0 | 970 | $2,250 | $2.32 | 2d | 2 | 0.47mi |
| 236 SE 9th Ave Deerfield Beach, FL | 1.0 | 1.0 | 650 | $1,645 | $2.53 | 13d | 1 | 0.54mi |
| 1100 SE 4th Ave #35 Deerfield Beach, FL | 2.0 | 1.5 | 1080 | $1,900 | $1.76 | 12d | 1 | 0.54mi |
| 224 SE 9th Ave Deerfield Beach, FL | 1.0 | 1.0 | 650 | $1,645 | $2.53 | 24d | 1 | 0.54mi |
| 431 SE 13th Ct Deerfield Beach, FL | 2.0 | 2.0 | 1100 | $2,160 | $1.96 | 13d | 1 | 0.63mi |
| 431 SE 13th Ct Deerfield Beach, FL | 2.0 | 2.0 | 1100 | $2,225 | $2.02 | 24d | 1 | 0.63mi |
HOA detail condo
- Monthly dues
- $482 · $5,784/yr
- Assessments
- None detected in remarks — confirm with the listing agent.
Listing history 30 events
-
2026-06-18days on market $175,000 Active 132 DOM
-
2026-06-17days on market $175,000 Active 131 DOM
-
2026-06-16days on market $175,000 Active 130 DOM
-
2026-06-15days on market $175,000 Active 129 DOM
-
2026-06-13days on market $175,000 Active 127 DOM
-
2026-06-09days on market $175,000 Active 123 DOM
-
2026-06-07days on market $175,000 Active 121 DOM
-
2026-06-04days on market $175,000 Active 118 DOM
-
2026-06-03days on market $175,000 Active 117 DOM
-
2026-06-02days on market $175,000 Active 116 DOM
-
2026-06-01days on market $175,000 Active 115 DOM
-
2026-05-31days on market $175,000 Active 114 DOM
-
2026-02-06$175,000 Active
-
2025-05-21historical $1,750
-
2025-03-23$1,750
-
2020-01-22soldstatus $118,000
-
2020-01-21soldstatus $118,000 Closed 114-char remark
Show marketing remark (114 chars)
Perfect apartment for investors or to live. Easy to rent! Tenant occupied but Tenant is leaving January 13th 2020.
-
2019-12-30status Pending 114-char remark
Show marketing remark (114 chars)
Perfect apartment for investors or to live. Easy to rent! Tenant occupied but Tenant is leaving January 13th 2020.
-
2019-12-12price $120,000 114-char remark
Show marketing remark (114 chars)
Perfect apartment for investors or to live. Easy to rent! Tenant occupied but Tenant is leaving January 13th 2020.
-
2019-12-11$125,000 Active 114-char remark
Show marketing remark (114 chars)
Perfect apartment for investors or to live. Easy to rent! Tenant occupied but Tenant is leaving January 13th 2020.
-
2018-09-26soldstatus $100,000
-
2006-06-29soldstatus $164,500
-
2005-02-09soldstatus $120,000 221-char remark
Show marketing remark (221 chars)
REMODELED 2/1, IN EAST DEERFIELD BEACH, NEWER APPLIANCES, AIR HANDLER, MARBLE FLOORS, FULLY TILED BATH WITH ITALIAN PORCEL, AND GLASS SLIDERS! PET FRIENDLY FOR SMALL PET <25/MAINT COVERS WATER, INS, ROOF, COMMON, TRASH
-
2004-11-23soldstatus $115,000
-
2004-10-20historical 221-char remark
Show marketing remark (221 chars)
REMODELED 2/1, IN EAST DEERFIELD BEACH, NEWER APPLIANCES, AIR HANDLER, MARBLE FLOORS, FULLY TILED BATH WITH ITALIAN PORCEL, AND GLASS SLIDERS! PET FRIENDLY FOR SMALL PET <25/MAINT COVERS WATER, INS, ROOF, COMMON, TRASH
-
2004-09-19$120,000 221-char remark
Show marketing remark (221 chars)
REMODELED 2/1, IN EAST DEERFIELD BEACH, NEWER APPLIANCES, AIR HANDLER, MARBLE FLOORS, FULLY TILED BATH WITH ITALIAN PORCEL, AND GLASS SLIDERS! PET FRIENDLY FOR SMALL PET <25/MAINT COVERS WATER, INS, ROOF, COMMON, TRASH
-
2003-07-18soldstatus $76,000
-
2003-07-15soldstatus $76,000
-
2003-06-15historical
-
2003-04-12$79,900
ⓘ Source: listings_history table (triggers on properties + properties_extension) + one-shot
backfill from property_details.listing_events for pre-trigger history.
Tax reassessment forecast FL · Resets to sale price
- Current annual tax
- $3,483 · $290/mo
- Projected year-2 tax
- $3,483 · $290/mo
- Expected delta
- $0/yr ($0/mo · 0.0%)
ⓘ Screening estimate from a state-policy table — verify with the county assessor before closing.
Climate risk First Street
- Flood 3/10 Moderate FEMA zone X (unshaded) · 10% chance over 30 yrs
- Wildfire 1/10 Low
- Heat 10/10 Extreme 7 d/yr ≥106°F today · 26 d/yr by 30 yrs out
- Wind 10/10 Extreme 99% chance of damaging wind over 30 yrs
- Air quality 2/10 Low 1 unhealthy d/yr today · 3 by 30 yrs out
Nearby sold comps map
Loading sold comps map…
Walkable amenities ~0.75 mi
Loading nearby amenities…
Taxation est. · year 1
- Rental income
- $24,887
- − Mortgage interest
- −$9,803
- − Property taxes
- −$3,483
- − Insurance
- −$875
- − Repairs & maintenance
- −$1,991
- − Management
- −$1,991
- − HOA
- −$5,784
- − Depreciation
- −$5,091
- Taxable loss
- −$4,130
- Est. tax savings @ 24.0%
- +$991
- After-tax cash flow
- $-503/yr
For passive investors: Depreciation is non-cash, so a rental often shows a tax loss while cash-flowing — sheltering income. Rental losses are passive: they offset passive income freely, and up to $25,000/yr can offset ordinary (W-2) income if you actively participate and your MAGI is under $100k (phasing out to $0 by $150k); unused losses carry forward. On sale, claimed depreciation is recaptured at up to 25%, and gains may owe capital-gains tax (a 1031 exchange can defer both). Figures are a year-1 estimate at your 24.0% rate — not tax advice; consult a CPA.
Schools (NCES district)
- District
- Broward
- NCES district ID
- 1200180
- Math proficiency
- 42% ▼ -18.00%
- Reading proficiency
- 53% ▼ -5.00%
- Median HH income
- $52,139
- Composite
- 40.88/100
- National rank
- #3621
- State rank
- #46 of 73 in FL
Livability — Deerfield Beach
- Score
- 75/100
- State rank
- #250
- US rank
- #3970
Category grades
Schools grade is shown separately in the Schools card above.
Census & demographics
- Census place
- Deerfield Beach, FL
- County
- Broward County · 1,963,430 people
- City population
- 61,449
- Metro
- Miami-Fort Lauderdale-Pompano Beach, FL
- Population (ZIP)
- 30,153
- Household income
- $58,594
- Rent vs Own
- Severe rent burden
- 2148.0
Population outlook (Broward County) Hauer SSP2
- Today (2025)
- 2,207,033 people
- By 2030
- 2,360,704 · +7.0%
- By 2040
- 2,661,208 · +20.6%
- By 2050
- 2,946,698 · +33.5%
- By 2075
- 3,602,273 · +63.2%
- By 2100
- 3,970,984 · +79.9%
Race, ethnicity, and origin ACS 2023
- Neighborhood character
- Highly diverse neighborhood (Simpson 0.71)
- Race & ethnicity
- White 39% Black 33% Hispanic / Latino 17% Two or more races 15% Asian 2%
- Hispanic origin (detail)
- Mexican 2% Puerto Rican 1% Cuban 3% Dominican 1%
- Common ancestry
- Hispanic 11% Estonian 5% Romanian 3%
- Foreign-born
- 29% · Canada, Jamaica, Guatemala
- Languages at home
- 65% English-only · Spanish 13% French/Haitian/Cajun 11% Other Indo-European 9%
Political lean MEDSL · Broward
- 2024 margin
- D (+17.0) · D 58.0% · R 41.0%
- 2008→2024 swing
- -17.8pp toward R · 2008: 34.7pp · 2024: 17.0pp
- All cycles
- 2024: D+17.0 2020: D+29.8 2016: D+35.0 2012: D+34.9 2008: D+34.7
Not yet ingested
- Civics
- —
Market trends
- HPI YoY
- ▼ -353.25%
- Current HPI
- 404.3829
- Rent YoY
- ▲ 2.17%
- Metro
- Miami-Fort Lauderdale-Pompano Beach, FL
- State GDP YoY
- ▲ 3.28%
- F500 in state
- 36
Industry mix (Fortune 500 HQ in FL)
| Industry | F500 HQs | Revenue |
|---|---|---|
| Industrial Technology | 2 | $29B |
|
||
| Insurance | 2 | $17B |
|
||
| Retail | 1 | $60B |
|
||
| Technology Distribution | 1 | $58B |
|
||
| Homebuilding | 1 | $35B |
|
||
| Technology Manufacturing | 1 | $35B |
|
||
Price history
+119.0% since first listed18 events — show timeline
- 2026-02-06 Listed $175,000 MARMLS
- 2025-05-21 Rental Removed $1,750 MARMLS
- 2025-03-23 Listed for Rent $1,750 MARMLS
- 2020-01-22 Sold (Public Records) $118,000 Public Records
- 2020-01-21 Sold (MLS) $118,000 MARMLS
- 2019-12-30 Pending — MARMLS
- 2019-12-12 Price Changed $120,000 MARMLS
- 2019-12-11 Listed $125,000 MARMLS
- 2018-09-26 Sold (Public Records) $100,000 Public Records
- 2006-06-29 Sold (Public Records) $164,500 Public Records
- 2005-02-09 Sold (MLS) $120,000 Beaches MLS
- 2004-11-23 Sold (Public Records) $115,000 Public Records
- 2004-10-20 Listing Removed — Beaches MLS
- 2004-09-19 Listed $120,000 Beaches MLS
- 2003-07-18 Sold (Public Records) $76,000 Public Records
- 2003-07-15 Sold (MLS) $76,000 Beaches MLS
- 2003-06-15 Listing Removed — Beaches MLS
- 2003-04-12 Listed $79,900 Beaches MLS
Property tax history
+26.1%/yrLatest (2025): $3,483 · +3.9% YoY. Source: county tax records.
Cash-flow waterfall
monthlySold comps — $/sqft
last 12 mo · ≤1 miLoading sold comps…