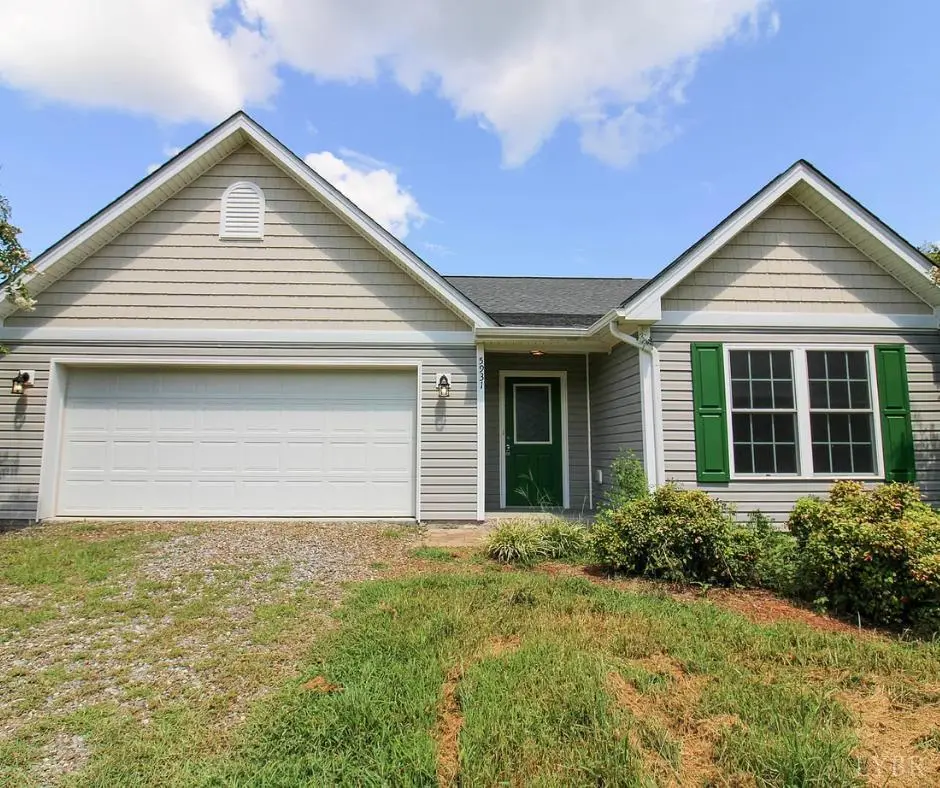
5931 Five Forks Rd Rd
Hampden-Sydney, VA 23958
$279,900D-
3 bd · 2.5 ba ·
1,572 sqft ·
Built 2014
· SingleFamily
· Active
· 125 DOM
Cashflow @ list (25.0% down · 7.5%)
Estimated rent
$1,324/mo
Mortgage (P&I)
−$1,468
Tax + insurance
−$205
HOA
−$17
Vac / Maint / Mgmt
−$278
Net cashflow
$-644/mo
Annual
$-7,725/yr
Cap rate
3.53%
Cash-on-cash
-9.86%
DSCR
0.56
1% rule
0.47%
Cash to close
$78,372
Investor read
- This is a 3-bed/2.5-bath single-family listed at $280k.
- At list price, monthly cash flow is $-644 ($-8k/yr) — negative.
- To cash-flow at today's rent, offer at most $166k (40.6% below list).
- To meet the 1% rule (rent ≥ 1% of price), the offer needs to be $132k (52.7% below list).
- It's been on market 125 days — a 12% lower offer ($246k) is reasonable based on typical stale-listing flexibility.
- Recommended offer: $132k (52.7% below list) — sets the bar for 1% rule.
- In year one you build about $20k of equity ($2k loan paydown + $18k appreciation (6.4% local appreciation)).
- Location reads: area grade D — affects rentability + tenant quality, not the cash-flow math above.
- Prince Edward County Public School District (town): math 25% / reading 48% proficiency, ranked #126 of 131 in VA (top 96%) — families likely to look elsewhere, expect single-tenant / working-renter base with shorter leases; 65% free/reduced lunch — lower-income household profile, screen leases tightly.
- Market conditions: 42 active listings in the ZIP; 65 units permitted in Prince Edward County in 2024 (5 in 5+ unit buildings).
- Prince Edward County population projected to shrink 9% by 2050 — rents likely to lag national; underwrite the cash flow, not the appreciation.
- 2 sale attempts with the ask held roughly flat each time — persistent listings suggest the price (not the market) is what's stuck; bring a comps-based counter.
- Current owner paid $237k; 18% above their basis — modest negotiation headroom, anchor on the comps not their cost.
- By year 2, paydown + projected appreciation supports a ~$32k cash-out refi (75% LTV) — recoverable capital for the next deal without selling this one.
- Climate carrying-cost: extreme-heat days projected 7→17/yr by 2055 (HVAC capex compounding) — expect insurance premiums to compound above CPI over the hold.
- Cap rate 3.5% vs local median 2.2% in Hampden-Sydney — top-decile yield for the area; either an underpriced asset or a hidden risk that comps aren't pricing in. Stress-test before assuming the spread holds.
Questions for listing agent
- What do current leases actually rent for vs. the listed asking? Can we see a recent rent roll and the last 12 months of T-12 income?
- It's been on market 125 days. Have you received any prior offers? Is the seller open to a 53% concession, seller financing, or rate buy-down credit?
- What does the HOA fee cover, when was the last increase, and are there any pending special assessments or reserve-fund shortfalls?
- Why hasn't it sold? Are there any deal-killer items the seller is aware of (foundation, flood, title, zoning, code violations)?
- Is there a deadline driving the sale (1031 exchange, divorce, estate, relocation)? That informs how much negotiation room exists.
- The area grade is low — what's the realistic commute time and amenity access for the typical tenant pool here? Any planned neighborhood developments (good or bad) we should know about?
- What's the average days-on-market for RENTAL listings here right now (not sales)? A rising rental-DOM trend means longer vacancies and softer asking-rent achievability than the comps imply.
- What's the recent tenant-quality profile in this submarket — average credit score on applications, eviction rate, late-payment / NSF rate, and stable-employment percentage? A property-management company in the area should have these aggregated.
CashFlowRE · CFR-8BGAYS26NMC4WT
· Data 13 h ago
cashflowre.app · 2026-05-29