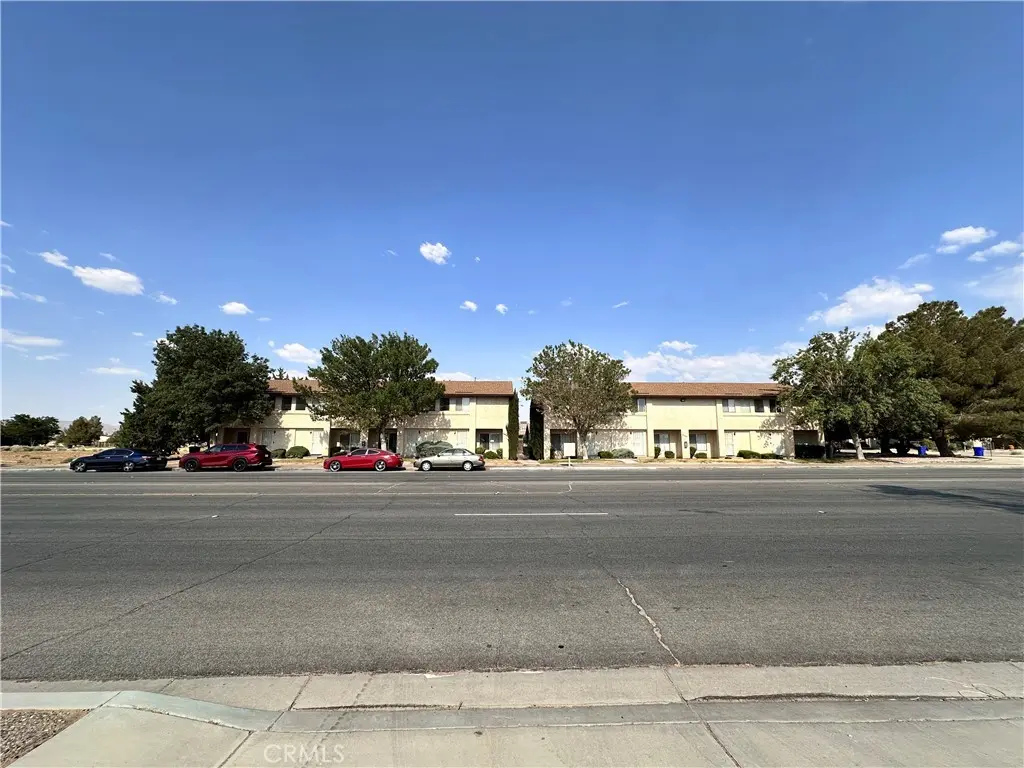
12745 Navajo Rd
Apple Valley, CA 92308
$1,895,000D
24 bd · 12.0 ba ·
9,440 sqft ·
Built 1985
· MultiFamily
· Active
· 55 DOM
Cashflow @ list (25.0% down · 7.5%)
Estimated rent
$15,384/mo
Mortgage (P&I)
−$9,938
Tax + insurance
−$2,175
HOA
−$0
Vac / Maint / Mgmt
−$3,231
Net cashflow
$41/mo
Annual
$489/yr
Cap rate
6.32%
Cash-on-cash
0.09%
DSCR
1.00
1% rule
0.81%
Cash to close
$530,600
Investor read
- This is a 8 × 3-bed/?-bath units multifamily listed at $1.90M.
- At list price, monthly cash flow is $41 ($489/yr) — positive. Per door: $5/mo.
- The deal already cash-flows at list — no discount required.
- To meet the 1% rule (rent ≥ 1% of price), the offer needs to be $1.54M (18.8% below list).
- It's been on market 55 days — a 3% lower offer ($1.84M) is reasonable based on typical stale-listing flexibility.
- Recommended offer: $1.54M (18.8% below list) — sets the bar for 1% rule.
- Local home prices are declining (-3.0%/yr); year-one equity from $13k of loan paydown is wiped out by about $57k of value loss. Plan a longer hold.
- Location reads 61/100 on livability (#532 in CA) — a middle-class / working-renter tenant base. Strengths: housing A+, commute B+; Watch: employment D+, schools F, crime D-.
- Apple Valley Unified (suburban): math 25% / reading 40% proficiency, ranked #955 of 1,400 in CA (top 68%) — families likely to look elsewhere, expect single-tenant / working-renter base with shorter leases; 60% free/reduced lunch — lower-income household profile, screen leases tightly.
- Market conditions: Rents rising fast (+4.3%/yr); 417 active listings in the ZIP; 5,458 units permitted in San Bernardino County in 2024 (1,500 in 5+ unit buildings).
- San Bernardino County population projected at +15% by 2050 — modest demand growth; plan on rents tracking national, not racing it.
- 11 sale attempts since 20y ago with the ask held roughly flat each time — persistent listings suggest the price (not the market) is what's stuck; bring a comps-based counter.
- Current owner paid $1.32M; 44% above their basis — modest negotiation headroom, anchor on the comps not their cost.
- Climate carrying-cost: major wildfire risk; extreme-heat days projected 5→14/yr by 2055 (HVAC capex compounding) — expect insurance premiums to compound above CPI over the hold.
- Cap rate 6.3% vs local median 3.5% in Apple Valley — top-decile yield for the area; either an underpriced asset or a hidden risk that comps aren't pricing in. Stress-test before assuming the spread holds.
- At $15,384/mo this rent would consume 277% of the median local household income ($67k/yr) (locally 1389% of renters already pay >50% of income on rent) — very limited rent-growth headroom before tenants either downsize or default.
Questions for listing agent
- It's been on market 55 days. Have you received any prior offers? Is the seller open to a 19% concession, seller financing, or rate buy-down credit?
- Can we see the unit-by-unit rent roll, current vacancy, and any below-market leases? What's the average tenancy length?
- What capital expenditures (roof, boiler, parking lot, exteriors) have been made in the last 5 years, and what's planned in the next 2?
- Is there a deadline driving the sale (1031 exchange, divorce, estate, relocation)? That informs how much negotiation room exists.
- Schools are F-rated, which usually means shorter tenancies and higher turnover. Who's the typical renter profile here, and what's been the actual vacancy rate?
- Crime grade is D in this area — have there been break-ins, vandalism, or insurance claims at this property in the last 3 years? What carrier currently insures it and at what premium?
- The area grade is low — what's the realistic commute time and amenity access for the typical tenant pool here? Any planned neighborhood developments (good or bad) we should know about?
- What's the average days-on-market for RENTAL listings here right now (not sales)? A rising rental-DOM trend means longer vacancies and softer asking-rent achievability than the comps imply.
CashFlowRE · CFR-8D7KV0FACQJ3TC
· Data 2 days ago
cashflowre.app · 2026-05-29