 8-Plex
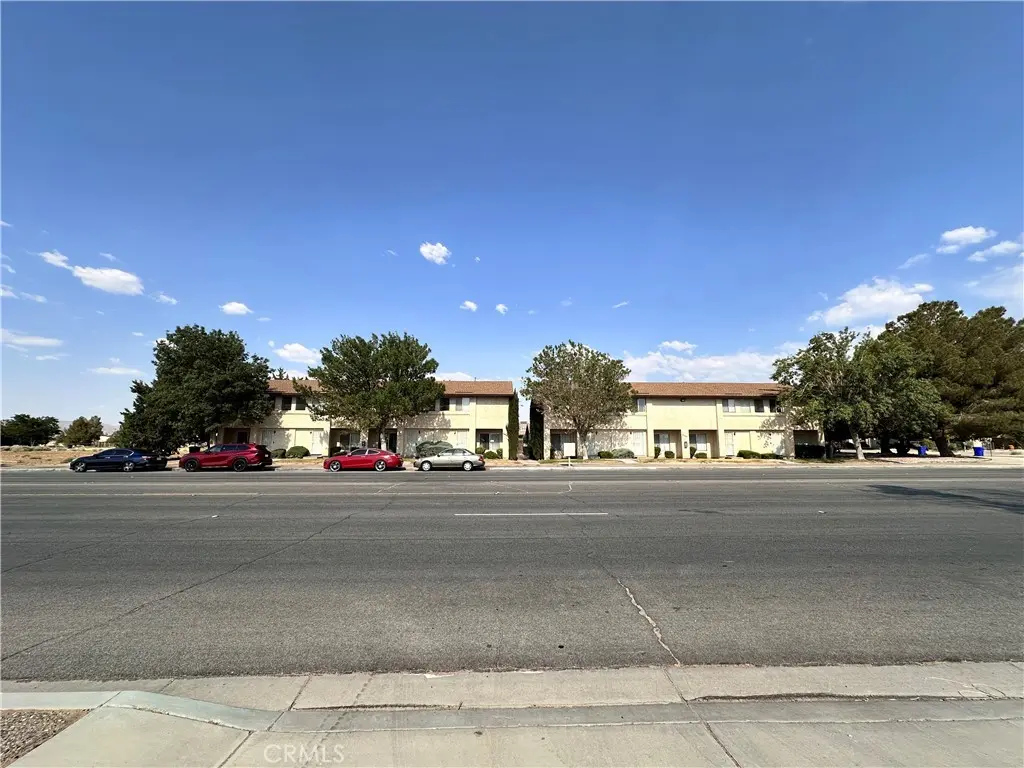
12745 Navajo Rd · Apple Valley, CA
Flood risk 1/10 · Minimal
- FEMA flood zone
- D
- Chance of flooding over 30 yrs
- 0.0%
- Est. flood insurance / yr
- $544 – $1,084
Fire risk 6/10 · Moderate
- Est. fire insurance / yr
- $659 – $1,223
Heat risk 7/10 · Major
- Hot days now (above 100°F)
- 5 days/yr
- Hot days in 30 yrs
- 14 days/yr
Wind risk 1/10 · Minimal
- Chance of severe wind over 30 yrs
- —
Air-quality risk 10/10 · Severe
- Unhealthy air days now
- 25 days/yr
- Unhealthy air days in 30 yrs
- 30 days/yr
Risk factors via First Street. Map © Google.
Why this score? — see what drove the D grade
The composite is a weighted blend of 9 inputs, each scored 0–100. Each bar is that input's sub-score; the figure is the points it added to the 100-point composite (weight × sub-score).
- Cash flow +13.4/30.0
- ARV discount +7.5/15.0
- DSCR +4.0/10.0
- Rent growth +3.6/5.0
- 1% rule +3.1/10.0
- Schools +3.1/10.0
- Livability +3.1/5.0
- Condition / age +2.5/5.0
- Appreciation +0.0/10.0
$1,895,000
🖨 Deal sheet 📄 Offer letter ✓ Due diligence
Multi-family units
County records classify this as Multi-Family (5+ Unit). Listing-text estimate: 8 units. confirmed
5+ unit building — per-unit beds/baths from public records are typically unavailable; the breakdown below (if shown) is an estimate from the listing text.
Listing remarks MLS
8 3 bedrooms and 1.5 bathrooms Townhome Style Units with a 2 Car Detached Garage that leads into a courtyard area and into apartment. 5.75% CAP RATE based upon ACTUAL CURRENT RENTS and upside in rents. All units have been rehabbed except for two, interior Washer and Dryer hook ups, 2 car detached garage, Recent upgrades: Asphalt recently re blacked topped, 4 brand new AC units installed, NO Deferred Maintenance. Owner Managed with over 40 years of experience so property well taken care of.
Key facts
- Recent upgrades
- Brand new ac units
- Courtyard area
Tags
Neighborhood map
What this means for you Summary
Snapshot
- This is a 8 × 3-bed/?-bath units multifamily listed at $1.90M.
Deal economics
- At list price, monthly cash flow is $41 ($489/yr) — positive. Per door: $5/mo.
- The deal already cash-flows at list — no discount required.
- To meet the 1% rule (rent ≥ 1% of price), the offer needs to be $1.54M (18.8% below list).
- Recommended offer: $1.54M (18.8% below list) — sets the bar for 1% rule.
- Cap rate 6.3% vs local median 3.5% in Apple Valley — top-decile yield for the area; either an underpriced asset or a hidden risk that comps aren't pricing in. Stress-test before assuming the spread holds.
Location & tenants
- Location reads 61/100 on livability (#532 in CA) — a middle-class / working-renter tenant base. Strengths: housing A+, commute B+; Watch: employment D+, schools F, crime D-.
- Apple Valley Unified (suburban): math 25% / reading 40% proficiency, ranked #955 of 1,400 in CA (top 68%) — families likely to look elsewhere, expect single-tenant / working-renter base with shorter leases; 60% free/reduced lunch — lower-income household profile, screen leases tightly.
- Market conditions: Rents rising fast (+4.3%/yr); 417 active listings in the ZIP; 5,458 units permitted in San Bernardino County in 2024 (1,500 in 5+ unit buildings).
- At $15,384/mo this rent would consume 277% of the median local household income ($67k/yr) (locally 1389% of renters already pay >50% of income on rent) — very limited rent-growth headroom before tenants either downsize or default.
Forward outlook
- Local home prices are declining (-3.0%/yr); year-one equity from $13k of loan paydown is wiped out by about $57k of value loss. Plan a longer hold.
- San Bernardino County population projected at +15% by 2050 — modest demand growth; plan on rents tracking national, not racing it.
Negotiation context
- It's been on market 55 days — a 3% lower offer ($1.84M) is reasonable based on typical stale-listing flexibility.
- 11 sale attempts since 20y ago with the ask held roughly flat each time — persistent listings suggest the price (not the market) is what's stuck; bring a comps-based counter.
- Current owner paid $1.32M; 44% above their basis — modest negotiation headroom, anchor on the comps not their cost.
Risks & watch-outs
- Climate carrying-cost: major wildfire risk; extreme-heat days projected 5→14/yr by 2055 (HVAC capex compounding) — expect insurance premiums to compound above CPI over the hold.
Questions for the listing agent
- It's been on market 55 days. Have you received any prior offers? Is the seller open to a 19% concession, seller financing, or rate buy-down credit?
- Can we see the unit-by-unit rent roll, current vacancy, and any below-market leases? What's the average tenancy length?
- What capital expenditures (roof, boiler, parking lot, exteriors) have been made in the last 5 years, and what's planned in the next 2?
- Is there a deadline driving the sale (1031 exchange, divorce, estate, relocation)? That informs how much negotiation room exists.
- Schools are F-rated, which usually means shorter tenancies and higher turnover. Who's the typical renter profile here, and what's been the actual vacancy rate?
- Crime grade is D in this area — have there been break-ins, vandalism, or insurance claims at this property in the last 3 years? What carrier currently insures it and at what premium?
- The area grade is low — what's the realistic commute time and amenity access for the typical tenant pool here? Any planned neighborhood developments (good or bad) we should know about?
- What's the average days-on-market for RENTAL listings here right now (not sales)? A rising rental-DOM trend means longer vacancies and softer asking-rent achievability than the comps imply.
- What's the recent tenant-quality profile in this submarket — average credit score on applications, eviction rate, late-payment / NSF rate, and stable-employment percentage? A property-management company in the area should have these aggregated.
- How much new apartment / multifamily construction is in the pipeline within 1–3 miles? Heavy new supply (>2% of stock underway) typically softens rents 12–24 months out; light construction supports rent growth.
Investment metrics
- 1% rule
- 0.81% ✗
- Cap rate
- 6.32%
- Cash-on-cash
- 0.09%
- DSCR
- 1.00
- GRM
- 10.3
CMA / ARV
No comps found within radius.
Projected returns pro-forma
-3.0% appreciation · 4.3% rent growth · sell at horizon
- IRR
- -14.8%
- Equity multiple
- 0.46×
- Total profit
- $-284,468
- Equity at exit
- $282,551
- IRR
- -4.3%
- Equity multiple
- 0.70×
- Total profit
- $-159,998
- Equity at exit
- $163,845
Cash invested: $530,600 (down + closing). Projections, not guarantees.
Landlord ↔ Tenant lean methodology
- Overall (STATE)
- 18 Strongly Tenant-Friendly
- State California
- 18 Strongly Tenant-Friendly · D+13
- County
- — inherits STATE
- City
- — inherits STATE
ZIP-level market 92308
- Home prices YoY
- -28.8%
- Rents YoY
- 4.3%
- Active inventory
- 417
- Price-to-rent
- 82.1×
Monthly cashflow live
- Estimated rent
- $15,384 high interval (Pro) →
- Mortgage (P&I)
- −$9,938
- Tax from tax record
- −$1,385 /mo · $16,626/yr
- Insurance
- −$790
- HOA
- −$0
- Vacancy / Maint / Mgmt
- −$3,231
- Net cashflow
- $41
Break-even live
8-unit breakdown (identical units grouped — click to expand)
| Units | Beds | Baths | Est. rent |
|---|---|---|---|
| 8× units | 3 | — | $15,384 |
| #1 | 3 | — | $1,923 |
| #2 | 3 | — | $1,923 |
| #3 | 3 | — | $1,923 |
| #4 | 3 | — | $1,923 |
| #5 | 3 | — | $1,923 |
| #6 | 3 | — | $1,923 |
| #7 | 3 | — | $1,923 |
| #8 | 3 | — | $1,923 |
| Total (8 units) | $15,384 | ||
UW: 25.0% down · 7.5% · 30yr · 1.5% tax · 5.0% vac · 8.0% maint · 8.0% mgmt
Financing live
Cash to close
- Down payment
- $473,750
- Closing costs
- $56,850
- Reserves months
- —
- Total cash needed
- —
Loan-product check · same deal, 3 products live
Conventional
25% down · 7.5% · 30yr
- Down + closing
- —
- Monthly P&I
- —
- Monthly cashflow
- —
- DSCR
- —
- Eligible?
- —
Personal DTI + credit; lowest rate.
DSCR
20% down · 8.5% · 30yr
- Down + closing
- —
- Monthly P&I
- —
- Monthly cashflow
- —
- DSCR
- —
- Eligible?
- —
No personal income docs; deal must DSCR.
Hard money
10% down · 12.0% · 12mo
- Down + closing
- —
- Monthly P&I
- —
- Monthly cashflow
- —
- DSCR
- —
- Eligible?
- —
Short-term bridge; refi at stabilization.
Listing history 47 events
-
2026-06-18days on market $1,895,000 Active 55 DOM
-
2026-06-17days on market $1,895,000 Active 54 DOM
-
2026-06-16days on market $1,895,000 Active 53 DOM
-
2026-06-15days on market $1,895,000 Active 52 DOM
-
2026-06-13days on market $1,895,000 Active 50 DOM
-
2026-06-13days on market $1,895,000 Active 49 DOM
-
2026-06-09days on market $1,895,000 Active 46 DOM
-
2026-06-08days on market $1,895,000 Active 45 DOM
-
2026-06-07days on market $1,895,000 Active 44 DOM
-
2026-06-04days on market $1,895,000 Active 41 DOM
-
2026-06-03days on market $1,895,000 Active 40 DOM
-
2026-06-02days on market $1,895,000 Active 39 DOM
-
2026-06-01days on market $1,895,000 Active 38 DOM
-
2026-05-31days on market $1,895,000 Active 37 DOM
-
2026-04-24$1,895,000 Active 494-char remark
Show marketing remark (494 chars)
8 3 bedrooms and 1.5 bathrooms Townhome Style Units with a 2 Car Detached Garage that leads into a courtyard area and into apartment. 5.75% CAP RATE based upon ACTUAL CURRENT RENTS and upside in rents. All units have been rehabbed except for two, interior Washer and Dryer hook ups, 2 car detached garage, Recent upgrades: Asphalt recently re blacked topped, 4 brand new AC units installed, NO Deferred Maintenance. Owner Managed with over 40 years of experience so property well taken care of.
-
2025-05-23historical
-
2025-04-21$1,975,000 Active
-
2024-10-06historical
-
2024-09-22price $2,150,000
-
2024-08-21price $2,198,888
-
2024-07-10$2,258,888 Active
-
2021-05-26soldstatus $1,320,000
-
2020-09-18historical
-
2020-09-04historical Active Under Contract
-
2020-06-30$1,300,000 Active
-
2016-03-28soldstatus $737,500
-
2016-03-28soldstatus $737,500 Closed Sale
-
2016-03-28soldstatus $737,500
-
2015-12-18status Pending Sale
-
2015-10-23$759,000 Active
-
2015-10-21$759,000
-
2014-03-21soldstatus $615,000
-
2014-03-21soldstatus $615,000
-
2014-03-20soldstatus $612,500 Closed
-
2014-03-20soldstatus $612,500
-
2014-02-07status Pending
-
2014-01-12$625,000 Active
-
2014-01-10$625,000
-
2014-01-10$625,000
-
2006-12-15soldstatus $960,000
-
2006-12-15soldstatus $960,000
-
2006-12-15soldstatus $960,000
-
2006-12-01soldstatus $960,000
-
2006-09-04$995,000
-
2006-08-09$995,000
-
1995-09-29soldstatus $225,000
-
1990-03-09soldstatus $435,000
ⓘ Source: listings_history table (triggers on properties + properties_extension) + one-shot
backfill from property_details.listing_events for pre-trigger history.
Tax reassessment forecast CA · Resets to sale price
- Current annual tax
- $16,626 · $1,385/mo
- Projected year-2 tax
- $16,626 · $1,385/mo
- Expected delta
- $0/yr ($0/mo · 0.0%)
ⓘ Screening estimate from a state-policy table — verify with the county assessor before closing.
Climate risk First Street
- Flood 1/10 Low FEMA zone D · 0% chance over 30 yrs
- Wildfire 6/10 Major
- Heat 7/10 Severe 5 d/yr ≥100°F today · 14 d/yr by 30 yrs out
- Wind 1/10 Low
- Air quality 10/10 Extreme 25 unhealthy d/yr today · 30 by 30 yrs out
Nearby sold comps map
Loading sold comps map…
Walkable amenities ~0.75 mi
Loading nearby amenities…
Taxation est. · year 1
- Rental income
- $184,608
- − Mortgage interest
- −$106,149
- − Property taxes
- −$16,626
- − Insurance
- −$9,475
- − Repairs & maintenance
- −$14,769
- − Management
- −$14,769
- − Depreciation
- −$55,127
- Taxable loss
- −$32,307
- Est. tax savings @ 24.0%
- +$7,754
- After-tax cash flow
- $8,242/yr
For passive investors: Depreciation is non-cash, so a rental often shows a tax loss while cash-flowing — sheltering income. Rental losses are passive: they offset passive income freely, and up to $25,000/yr can offset ordinary (W-2) income if you actively participate and your MAGI is under $100k (phasing out to $0 by $150k); unused losses carry forward. On sale, claimed depreciation is recaptured at up to 25%, and gains may owe capital-gains tax (a 1031 exchange can defer both). Figures are a year-1 estimate at your 24.0% rate — not tax advice; consult a CPA.
Schools (NCES district)
- District
- Apple Valley Unified
- NCES district ID
- 0600017
- Math proficiency
- 25% ▬ 0.00%
- Reading proficiency
- 40% ▬ 0.00%
- Median HH income
- $49,264
- Composite
- 30.91/100
- National rank
- #11351
- State rank
- #955 of 1400 in CA
Livability — Apple Valley
- Score
- 61/100
- State rank
- #532
- US rank
- #17800
Category grades
Schools grade is shown separately in the Schools card above.
Census & demographics
- Census place
- Apple Valley, CA
- County
- San Bernardino County · 2,030,291 people
- City population
- 83,889
- Metro
- Riverside-San Bernardino-Ontario, CA
- Population (ZIP)
- 42,709
- Household income
- $66,568
- Rent vs Own
- Severe rent burden
- 1389.0
Population outlook (San Bernardino County) Hauer SSP2
- Today (2025)
- 2,300,329 people
- By 2030
- 2,378,907 · +3.4%
- By 2040
- 2,523,137 · +9.7%
- By 2050
- 2,642,388 · +14.9%
- By 2075
- 2,880,769 · +25.2%
- By 2100
- 2,909,436 · +26.5%
Race, ethnicity, and origin ACS 2023
- Neighborhood character
- Diverse neighborhood (Simpson 0.65)
- Race & ethnicity
- White 44% Hispanic / Latino 38% Two or more races 19% Black 9% Asian 3%
- Hispanic origin (detail)
- Mexican 34%
- Common ancestry
- Italian 1% Iranian 1% Slovak 1%
- Foreign-born
- 11% · Canada, South Korea
- Languages at home
- 75% English-only · Spanish 20% Tagalog/Filipino 1% Other Asian/Pacific 1%
Political lean MEDSL · San Bernardino
- 2024 margin
- Toss-up / Even · D 47.5% · R 49.7% · Other 2.8%
- 2008→2024 swing
- -8.5pp toward R · 2008: 6.3pp · 2024: -2.1pp
- All cycles
- 2024: R+2.1 2020: D+10.7 2016: D+9.8 2012: D+5.4 2008: D+6.3
Not yet ingested
- Civics
- —
Market trends
- HPI YoY
- ▼ -145.60%
- Current HPI
- 359.2305
- Rent YoY
- ▲ 4.30%
- Metro
- Riverside-San Bernardino-Ontario, CA
- State GDP YoY
- ▲ 3.21%
- F500 in state
- 116
Industry mix (Fortune 500 HQ in CA)
| Industry | F500 HQs | Revenue |
|---|---|---|
| Technology | 27 | $1,492B |
|
||
| Financial Services | 3 | $174B |
|
||
| Retail | 3 | $44B |
|
||
| Insurance | 3 | $26B |
|
||
| Media / Entertainment | 2 | $115B |
|
||
| Pharmaceuticals / Biotech | 2 | $62B |
|
||
Price history
+335.6% since first listed33 events — show timeline
- 2026-04-24 Listed $1,895,000 CRMLS
- 2025-05-23 Listing Removed — CRMLS
- 2025-04-21 Listed $1,975,000 CRMLS
- 2024-10-06 Listing Removed — CRMLS
- 2024-09-22 Price Changed $2,150,000 CRMLS
- 2024-08-21 Price Changed $2,198,888 CRMLS
- 2024-07-10 Listed $2,258,888 CRMLS
- 2021-05-26 Sold (Public Records) $1,320,000 Public Records
- 2020-09-18 Listing Removed — CRMLS
- 2020-09-04 Contingent — CRMLS
- 2020-06-30 Listed $1,300,000 CRMLS
- 2016-03-28 Sold (Public Records) $737,500 Public Records
- 2016-03-28 Sold (MLS) $737,500 CRMLS
- 2016-03-28 Sold (MLS) $737,500 SDMLS
- 2015-12-18 Pending — CRMLS
- 2015-10-23 Listed $759,000 CRMLS
- 2015-10-21 Listed $759,000 SDMLS
- 2014-03-21 Sold (MLS) $615,000 SDMLS
- 2014-03-21 Sold (MLS) $615,000 CRMLS
- 2014-03-20 Sold (Public Records) $612,500 Public Records
- 2014-03-20 Sold (MLS) $612,500 CRMLS
- 2014-02-07 Pending — CRMLS
- 2014-01-12 Listed $625,000 CRMLS
- 2014-01-10 Listed $625,000 SDMLS
- 2014-01-10 Listed $625,000 CRMLS
- 2006-12-15 Sold (Public Records) $960,000 Public Records
- 2006-12-15 Sold (MLS) $960,000 CRMLS
- 2006-12-15 Sold (MLS) $960,000 CRMLS
- 2006-12-01 Sold (MLS) $960,000 CRMLS
- 2006-09-04 Listed $995,000 CRMLS
- 2006-08-09 Listed $995,000 CRMLS
- 1995-09-29 Sold (Public Records) $225,000 Public Records
- 1990-03-09 Sold (Public Records) $435,000 Public Records
Property tax history
+2.4%/yrLatest (2025): $16,626 · +2.9% YoY. Source: county tax records.
Cash-flow waterfall
monthlySold comps — $/sqft
last 12 mo · ≤1 miLoading sold comps…