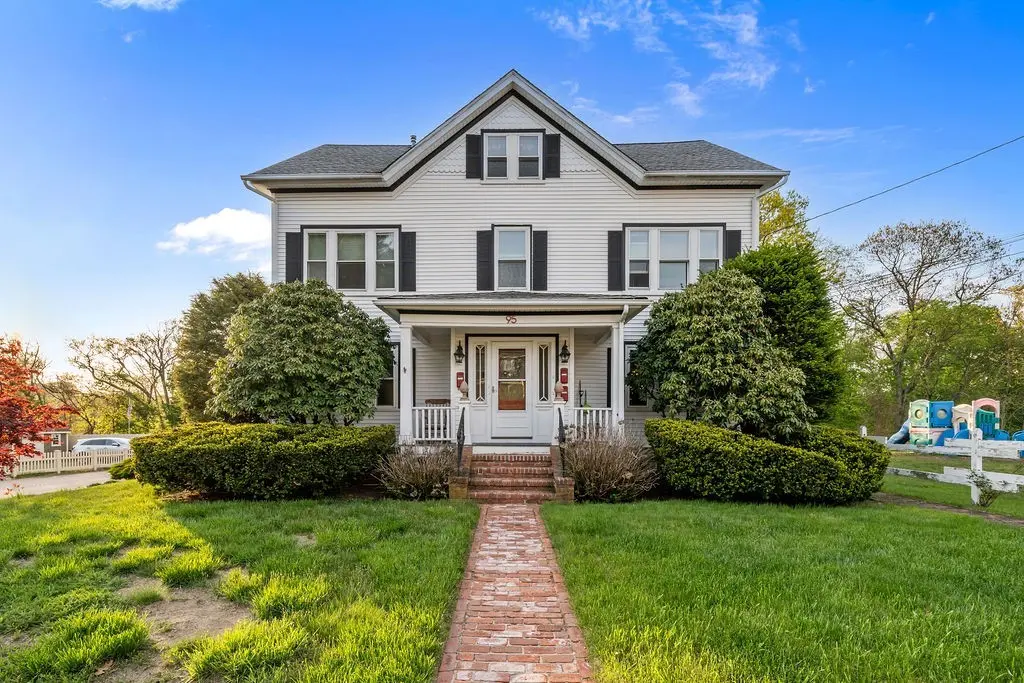
95 Saint Paul St
Woonsocket, RI 02896
$700,000C-
7 bd · 4.0 ba ·
4,358 sqft ·
Built 1922
· MultiFamily
· Pending
· 12 DOM
Cashflow @ list (25.0% down · 7.5%)
Estimated rent
$7,054/mo
Mortgage (P&I)
−$3,671
Tax + insurance
−$928
HOA
−$0
Vac / Maint / Mgmt
−$1,481
Net cashflow
$974/mo
Annual
$11,686/yr
Cap rate
7.96%
Cash-on-cash
5.96%
DSCR
1.27
1% rule
1.01%
Cash to close
$196,000
Investor read
- This is a 2 × 4-bed/?-bath units multifamily listed at $700k.
- At list price, monthly cash flow is $974 ($12k/yr) — positive. Per door: $487/mo.
- The deal already cash-flows at list — no discount required.
- Meets the 1% rule at list price ($7k rent vs $700k).
- Only 12 days on market — expect competitive offers; lowballing is unlikely to land.
- Local home prices are declining (-3.0%/yr); year-one equity from $5k of loan paydown is wiped out by about $21k of value loss. Plan a longer hold.
- Location reads 65/100 on livability (#24 in RI) — a middle-class / working-renter tenant base. Strengths: housing A+, health & safety A+, cost of living A; Watch: crime C-, schools D-, amenities F.
- North Smithfield (suburban): math 36% / reading 56% proficiency, ranked #8 of 39 in RI (top 20%) — families likely to look elsewhere, expect single-tenant / working-renter base with shorter leases; only 12% free/reduced lunch — higher-income household profile.
- Watch-outs: built in 1922 — expect roof / HVAC / electrical / plumbing capex.
- Market conditions: 62 active listings in the ZIP; 776 units permitted in Providence County in 2024 (229 in 5+ unit buildings).
- Providence County population projected at +5% by 2050 — modest demand growth; plan on rents tracking national, not racing it.
- 2 sale attempts since 13y ago with the ask held roughly flat each time — persistent listings suggest the price (not the market) is what's stuck; bring a comps-based counter.
- Current owner paid $250k; list at $700k implies a 180% gain — meaningful room to come down on a strong offer.
- Climate carrying-cost: major wind risk, 62% chance of damaging wind over 30y — expect insurance premiums to compound above CPI over the hold.
- Cap rate 8.0% vs local median 3.3% in Woonsocket — top-decile yield for the area; either an underpriced asset or a hidden risk that comps aren't pricing in. Stress-test before assuming the spread holds.
Questions for listing agent
- Can we see the unit-by-unit rent roll, current vacancy, and any below-market leases? What's the average tenancy length?
- What capital expenditures (roof, boiler, parking lot, exteriors) have been made in the last 5 years, and what's planned in the next 2?
- Built in 1922 — when were the roof, HVAC, electrical panel, plumbing, and water heater last replaced?
- Is there a deadline driving the sale (1031 exchange, divorce, estate, relocation)? That informs how much negotiation room exists.
- Schools are D-rated, which usually means shorter tenancies and higher turnover. Who's the typical renter profile here, and what's been the actual vacancy rate?
- What's the average days-on-market for RENTAL listings here right now (not sales)? A rising rental-DOM trend means longer vacancies and softer asking-rent achievability than the comps imply.
- What's the recent tenant-quality profile in this submarket — average credit score on applications, eviction rate, late-payment / NSF rate, and stable-employment percentage? A property-management company in the area should have these aggregated.
- How much new apartment / multifamily construction is in the pipeline within 1–3 miles? Heavy new supply (>2% of stock underway) typically softens rents 12–24 months out; light construction supports rent growth.
CashFlowRE · CFR-8D9BSN2MCQHHSA
· Data 1 week ago
cashflowre.app · 2026-05-29