 Duplex
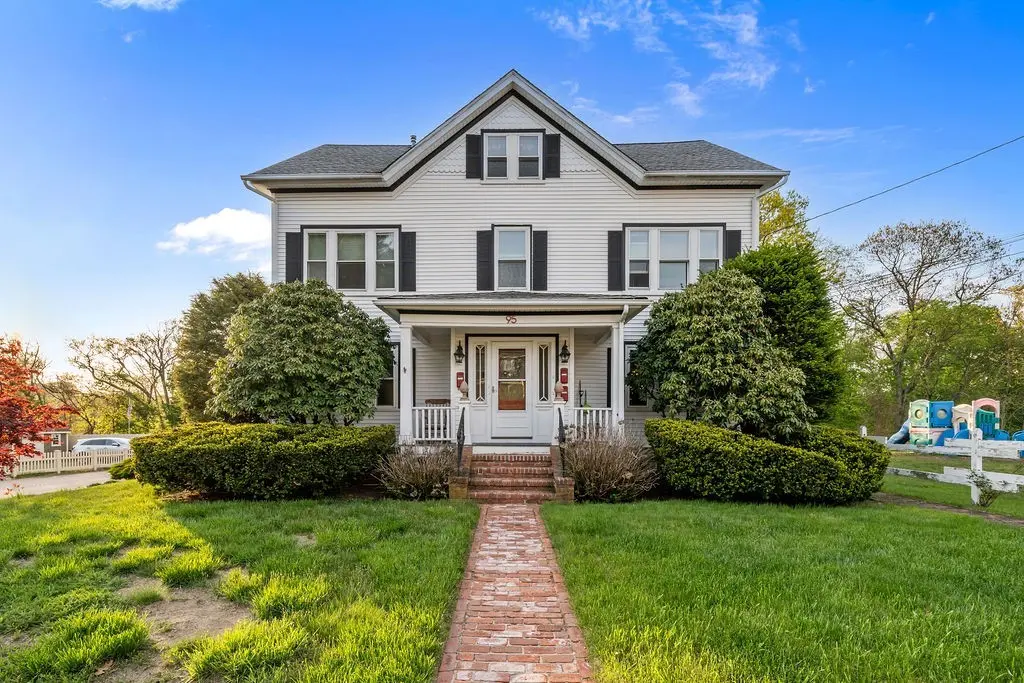
95 Saint Paul St · Woonsocket, RI
Flood risk 1/10 · Minimal
- FEMA flood zone
- X (unshaded)
- Chance of flooding over 30 yrs
- 0.0%
- Est. flood insurance / yr
- $473 – $860
Fire risk 3/10 · Minor
- Est. fire insurance / yr
- $835 – $1,551
Heat risk 4/10 · Minor
- Hot days now (above 95°F)
- 7 days/yr
- Hot days in 30 yrs
- 15 days/yr
Wind risk 6/10 · Moderate
- Chance of severe wind over 30 yrs
- 62.0%
Air-quality risk 2/10 · Minimal
- Unhealthy air days now
- 1 days/yr
- Unhealthy air days in 30 yrs
- 2 days/yr
Risk factors via First Street. Map © Google.
Why this score? — see what drove the C- grade
The composite is a weighted blend of 9 inputs, each scored 0–100. Each bar is that input's sub-score; the figure is the points it added to the 100-point composite (weight × sub-score).
- Cash flow +20.9/30.0
- ARV discount +8.3/15.0
- DSCR +6.7/10.0
- 1% rule +5.1/10.0
- Schools +4.2/10.0
- Livability +3.2/5.0
- Rent growth +2.5/5.0
- Condition / age +2.5/5.0
- Appreciation +0.0/10.0
$700,000
🖨 Deal sheet 📄 Offer letter ✓ Due diligence
Multi-family units
County records classify this as Multi-Family (2-4 Unit). Listing-text estimate: 2 units. confirmed
Listing remarks MLS
Spectacular owner occupant opportunity. Well maintained 3 unit with high ceilings, hardwoods and tile. Eat in kitchens and updated baths. 2 car garage. 1st floor master suite and stone fireplace. Brick patio. Side yard faces quiet chapel Street.
Key facts
- 9,148 sq ft lot
- 2 garage spots
- Built 1922
Property features AI
Finance
- Financial info: Income-producing multifamily: unit rents reported at approximately $1,350 and $1,800 for two of the 2-bedroom units
- HOA & community: No HOA details provided
Exterior
- Parking: Attached and detached garage spaces; Total of 8 parking spaces (2 covered); Attached 2-car garage
- Utilities: Sewer connected; Public water connected; 200+ amp electric service
- Home design: Multi-family property with 3 total units in 2 buildings; 3 stories
- Construction: Vinyl siding with drywall and plaster interiors; Concrete perimeter foundation; Built-up area above grade: 4,394
- Exterior features: Public transportation nearby; Close to shopping and restaurants; Near hospital and schools; Highway access
Interior
- Kitchen: Refrigerator; Range/oven; Microwave; Dishwasher
- Bedrooms: Three 2-bedroom units; One 3-bedroom unit
- Flooring: Hardwood; Vinyl
- Bathrooms: Four full bathrooms (property total)
- Heating & cooling: Gas heating; Steam heating; Window air conditioning units
- Interior features: Interior steps; Tub with shower; Common-area laundry; Full, unfinished basement with both interior and exterior access
- Laundry & utility: Washer and dryer included; Oil water heater
Neighborhood map
What this means for you Summary
Snapshot
- This is a 2 × 4-bed/?-bath units multifamily listed at $700k.
Deal economics
- At list price, monthly cash flow is $974 ($12k/yr) — positive. Per door: $487/mo.
- The deal already cash-flows at list — no discount required.
- Meets the 1% rule at list price ($7k rent vs $700k).
- Cap rate 8.0% vs local median 3.3% in Woonsocket — top-decile yield for the area; either an underpriced asset or a hidden risk that comps aren't pricing in. Stress-test before assuming the spread holds.
Location & tenants
- Location reads 65/100 on livability (#24 in RI) — a middle-class / working-renter tenant base. Strengths: housing A+, health & safety A+, cost of living A; Watch: crime C-, schools D-, amenities F.
- North Smithfield (suburban): math 36% / reading 56% proficiency, ranked #8 of 39 in RI (top 20%) — families likely to look elsewhere, expect single-tenant / working-renter base with shorter leases; only 12% free/reduced lunch — higher-income household profile.
- Market conditions: 62 active listings in the ZIP; 776 units permitted in Providence County in 2024 (229 in 5+ unit buildings).
Forward outlook
- Local home prices are declining (-3.0%/yr); year-one equity from $5k of loan paydown is wiped out by about $21k of value loss. Plan a longer hold.
- Providence County population projected at +5% by 2050 — modest demand growth; plan on rents tracking national, not racing it.
Negotiation context
- Only 12 days on market — expect competitive offers; lowballing is unlikely to land.
- 2 sale attempts since 13y ago with the ask held roughly flat each time — persistent listings suggest the price (not the market) is what's stuck; bring a comps-based counter.
- Current owner paid $250k; list at $700k implies a 180% gain — meaningful room to come down on a strong offer.
Risks & watch-outs
- Watch-outs: built in 1922 — expect roof / HVAC / electrical / plumbing capex.
- Climate carrying-cost: major wind risk, 62% chance of damaging wind over 30y — expect insurance premiums to compound above CPI over the hold.
Questions for the listing agent
- Can we see the unit-by-unit rent roll, current vacancy, and any below-market leases? What's the average tenancy length?
- What capital expenditures (roof, boiler, parking lot, exteriors) have been made in the last 5 years, and what's planned in the next 2?
- Built in 1922 — when were the roof, HVAC, electrical panel, plumbing, and water heater last replaced?
- Is there a deadline driving the sale (1031 exchange, divorce, estate, relocation)? That informs how much negotiation room exists.
- Schools are D-rated, which usually means shorter tenancies and higher turnover. Who's the typical renter profile here, and what's been the actual vacancy rate?
- What's the average days-on-market for RENTAL listings here right now (not sales)? A rising rental-DOM trend means longer vacancies and softer asking-rent achievability than the comps imply.
- What's the recent tenant-quality profile in this submarket — average credit score on applications, eviction rate, late-payment / NSF rate, and stable-employment percentage? A property-management company in the area should have these aggregated.
- How much new apartment / multifamily construction is in the pipeline within 1–3 miles? Heavy new supply (>2% of stock underway) typically softens rents 12–24 months out; light construction supports rent growth.
Investment metrics
- 1% rule
- 1.01% ✓
- Cap rate
- 7.96%
- Cash-on-cash
- 5.96%
- DSCR
- 1.27
- GRM
- 8.3
CMA / ARV
- ARV (median comp)
- $712,543
- List price
- $700,000
- Delta
- -1.76%
- Verdict
- FAIR
- Comps
- 9 within 1.0 mi
Show comp detail 3 sales within ~0.75 mi
| Address | Dist | Beds/Ba | Sqft | Sold | Price | $/sf | Match |
|---|---|---|---|---|---|---|---|
| 88-90 Saint Paul St | 0.06mi | 8/3.0 (+1) | 4,286 (-2%) | 12mo | $700,000 | $163 | 75 |
| 28 Main St | 0.60mi | 8/4.0 (+1) | 4,300 (-1%) | 11mo | $585,000 | $136 | 55 |
| 103 Main St | 0.39mi | 6/2.0 (-1) | 3,837 (-12%) | 12mo | $625,000 | $163 | 39 |
Match score weights: distance 35% · size 25% · config 20% · recency 20%. Top-matched comps best support the ARV.
Projected returns pro-forma
-3.0% appreciation · 3.0% rent growth · sell at horizon
- IRR
- -7.1%
- Equity multiple
- 0.74×
- Total profit
- $-51,444
- Equity at exit
- $104,372
- IRR
- 2.5%
- Equity multiple
- 1.18×
- Total profit
- $34,908
- Equity at exit
- $60,523
Cash invested: $196,000 (down + closing). Projections, not guarantees.
Landlord ↔ Tenant lean methodology
- Overall (STATE)
- 31 Tenant-Leaning
- State Rhode Island
- 31 Tenant-Leaning · D+8
- County
- — inherits STATE
- City
- — inherits STATE
ZIP-level market 02896
- Home prices YoY
- -31.5%
- Active inventory
- 62
- Price-to-rent
- 16.5×
Monthly cashflow live
- Estimated rent
- $7,054 medium interval (Pro) →
- Mortgage (P&I)
- −$3,671
- Tax from tax record
- −$636 /mo · $7,635/yr
- Insurance
- −$292
- HOA
- −$0
- Vacancy / Maint / Mgmt
- −$1,481
- Net cashflow
- $974
Break-even live
2-unit breakdown (identical units grouped — click to expand)
| Units | Beds | Baths | Est. rent |
|---|---|---|---|
| 2× units | 4 | — | $7,054 |
| #1 | 4 | — | $3,527 |
| #2 | 4 | — | $3,527 |
| Total (2 units) | $7,054 | ||
UW: 25.0% down · 7.5% · 30yr · 1.5% tax · 5.0% vac · 8.0% maint · 8.0% mgmt
Financing live
Cash to close
- Down payment
- $175,000
- Closing costs
- $21,000
- Reserves months
- —
- Total cash needed
- —
Loan-product check · same deal, 3 products live
Conventional
25% down · 7.5% · 30yr
- Down + closing
- —
- Monthly P&I
- —
- Monthly cashflow
- —
- DSCR
- —
- Eligible?
- —
Personal DTI + credit; lowest rate.
DSCR
20% down · 8.5% · 30yr
- Down + closing
- —
- Monthly P&I
- —
- Monthly cashflow
- —
- DSCR
- —
- Eligible?
- —
No personal income docs; deal must DSCR.
Hard money
10% down · 12.0% · 12mo
- Down + closing
- —
- Monthly P&I
- —
- Monthly cashflow
- —
- DSCR
- —
- Eligible?
- —
Short-term bridge; refi at stabilization.
Listing history 5 events
-
2026-05-07$700,000 Active 807-char remark
-
2013-12-18soldstatus $250,000
-
2013-12-17soldstatus $250,000 Sold 245-char remark
Show marketing remark (245 chars)
Spectacular owner occupant opportunity. Well maintained 3 unit with high ceilings, hardwoods and tile. Eat in kitchens and updated baths. 2 car garage. 1st floor master suite and stone fireplace. Brick patio. Side yard faces quiet chapel Street.
-
2013-10-02historical 245-char remark
Show marketing remark (245 chars)
Spectacular owner occupant opportunity. Well maintained 3 unit with high ceilings, hardwoods and tile. Eat in kitchens and updated baths. 2 car garage. 1st floor master suite and stone fireplace. Brick patio. Side yard faces quiet chapel Street.
-
2013-09-13$255,000 245-char remark
Show marketing remark (245 chars)
Spectacular owner occupant opportunity. Well maintained 3 unit with high ceilings, hardwoods and tile. Eat in kitchens and updated baths. 2 car garage. 1st floor master suite and stone fireplace. Brick patio. Side yard faces quiet chapel Street.
ⓘ Source: listings_history table (triggers on properties + properties_extension) + one-shot
backfill from property_details.listing_events for pre-trigger history.
Tax reassessment forecast RI · Partial reset (capped growth)
- Current annual tax
- $7,635 · $636/mo
- Projected year-2 tax
- $9,522 · $794/mo
- Expected delta
- +$1,888/yr (+$157/mo · 24.7%)
ⓘ Screening estimate from a state-policy table — verify with the county assessor before closing.
Climate risk First Street
- Flood 1/10 Low FEMA zone X (unshaded) · 0% chance over 30 yrs
- Wildfire 3/10 Moderate
- Heat 4/10 Moderate 7 d/yr ≥95°F today · 15 d/yr by 30 yrs out
- Wind 6/10 Major 62% chance of damaging wind over 30 yrs
- Air quality 2/10 Low 1 unhealthy d/yr today · 2 by 30 yrs out
Nearby sold comps map
Loading sold comps map…
Walkable amenities ~0.75 mi
Loading nearby amenities…
Taxation est. · year 1
- Rental income
- $84,648
- − Mortgage interest
- −$39,211
- − Property taxes
- −$7,635
- − Insurance
- −$3,500
- − Repairs & maintenance
- −$6,772
- − Management
- −$6,772
- − Depreciation
- −$20,364
- Taxable income
- $395
- Est. tax owed @ 24.0%
- −$95
- After-tax cash flow
- $11,592/yr
For passive investors: Depreciation is non-cash, so a rental often shows a tax loss while cash-flowing — sheltering income. Rental losses are passive: they offset passive income freely, and up to $25,000/yr can offset ordinary (W-2) income if you actively participate and your MAGI is under $100k (phasing out to $0 by $150k); unused losses carry forward. On sale, claimed depreciation is recaptured at up to 25%, and gains may owe capital-gains tax (a 1031 exchange can defer both). Figures are a year-1 estimate at your 24.0% rate — not tax advice; consult a CPA.
Schools (NCES district)
- District
- North Smithfield
- NCES district ID
- 4400810
- Math proficiency
- 36% ▼ -14.00%
- Reading proficiency
- 56% ▼ -6.00%
- Median HH income
- $76,012
- Composite
- 41.87/100
- National rank
- #3374
- State rank
- #8 of 39 in RI
Livability — Woonsocket
- Score
- 65/100
- State rank
- #24
- US rank
- #12968
Category grades
Schools grade is shown separately in the Schools card above.
Census & demographics
- City population
- 43,521
- Population (ZIP)
- 11,683
Population outlook (Providence County) Hauer SSP2
- Today (2025)
- 653,469 people
- By 2030
- 660,819 · +1.1%
- By 2040
- 672,747 · +3.0%
- By 2050
- 683,741 · +4.6%
- By 2075
- 720,435 · +10.2%
- By 2100
- 741,582 · +13.5%
Race, ethnicity, and origin ACS 2023
- Neighborhood character
- Predominantly White (94%)
- Race & ethnicity
- White 94% Hispanic / Latino 3% Two or more races 2%
- Common ancestry
- Lithuanian 23% Russian 6% Romanian 5%
- Foreign-born
- 4% · Canada, Jamaica
- Languages at home
- 93% English-only · French/Haitian/Cajun 2% Spanish 1% Russian/Polish/Slavic 1%
Political lean MEDSL · Providence
- 2024 margin
- D (+14.4) · D 56.1% · R 41.7% · Other 2.2%
- 2008→2024 swing
- -20.0pp toward R · 2008: 34.4pp · 2024: 14.4pp
- All cycles
- 2024: D+14.4 2020: D+22.9 2016: D+21.2 2012: D+34.9 2008: D+34.4
Not yet ingested
- Civics
- —
Market trends
- HPI YoY
- ▼ -135.81%
- Current HPI
- 295.1705
- Rent YoY
- —
- Metro
- —
- State GDP YoY
- ▲ 2.25%
- F500 in state
- 10
Industry mix (Fortune 500 HQ in RI)
| Industry | F500 HQs | Revenue |
|---|---|---|
| Healthcare | 1 | $373B |
|
||
| Food Distribution | 1 | $31B |
|
||
| Aerospace / Defense | 1 | $14B |
|
||
| Financial Services | 1 | $8B |
|
||
| Consumer Goods | 1 | $4B |
|
||
Price history
+174.5% since first listed6 events — show timeline
- 2026-05-19 Pending — RIS
- 2026-05-07 Listed $700,000 RIS
- 2013-12-18 Sold (Public Records) $250,000 Public Records
- 2013-12-17 Sold (MLS) $250,000 RIS
- 2013-10-02 Listing Removed — RIS
- 2013-09-13 Listed $255,000 RIS
Property tax history
+4.2%/yrLatest (2025): $7,635 · +37.5% YoY. Source: county tax records.
Cash-flow waterfall
monthlySold comps — $/sqft
last 12 mo · ≤1 miLoading sold comps…