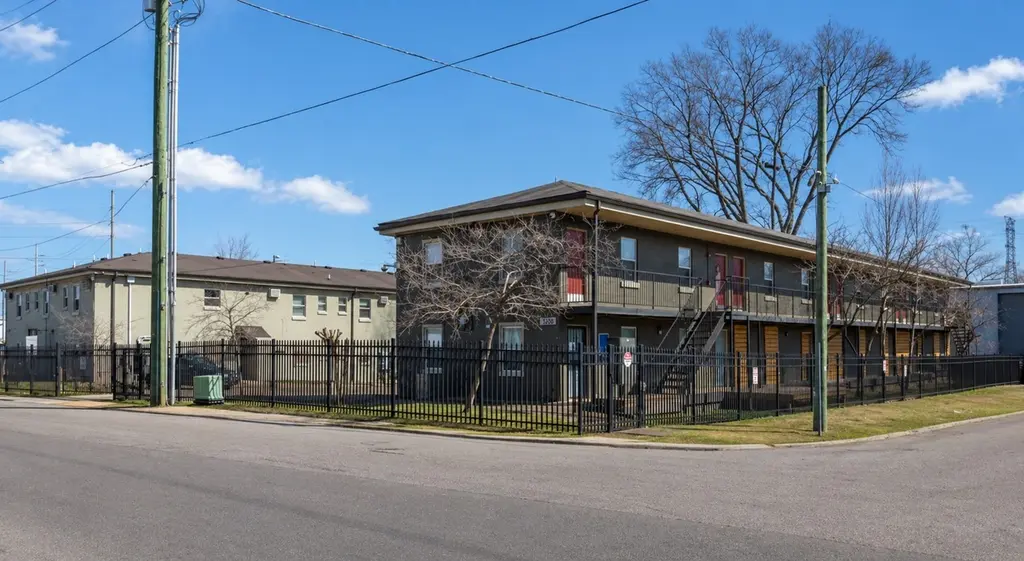
1216 Lewis St
Nashville-Davidson metropolitan government (balance), TN 37210
$2,535,000F
78 bd · 78.0 ba ·
9,558 sqft ·
Built 1969
· MultiFamily
· Active
· 17 DOM
Cashflow @ list (25.0% down · 7.5%)
Estimated rent
$5,997/mo
Mortgage (P&I)
−$13,294
Tax + insurance
−$3,848
HOA
−$0
Vac / Maint / Mgmt
−$1,259
Net cashflow
$-12,404/mo
Annual
$-148,851/yr
Cap rate
0.62%
Cash-on-cash
-20.25%
DSCR
0.10
1% rule
0.24%
Cash to close
$709,800
Investor read
- This is a 3 × 2-bed/2-bath units multifamily listed at $2.54M.
- At list price, monthly cash flow is $-12k ($-149k/yr) — negative. Per door: $-4k/mo.
- To cash-flow at today's rent, offer at most $568k (77.6% below list).
- To meet the 1% rule (rent ≥ 1% of price), the offer needs to be $600k (76.3% below list).
- It's been on market 17 days — a 2% lower offer ($2.50M) is reasonable based on typical stale-listing flexibility.
- Recommended offer: $568k (77.6% below list) — sets the bar for cash-flow.
- Local home prices are declining (-3.0%/yr); year-one equity from $18k of loan paydown is wiped out by about $76k of value loss. Plan a longer hold.
- Location reads: area grade F — affects rentability + tenant quality, not the cash-flow math above.
- Davidson County (urban): math 12% / reading 19% proficiency, ranked #126 of 139 in TN (top 91%) — low school quality limits family demand, transient renter base, plan for 1-2y turnover; 66% free/reduced lunch — lower-income household profile, screen leases tightly.
- Zoned schools: John B. Whitsitt Elementary (math 2% / reading 8%, grade F, #896 of 952 statewide, top 96%, 484 students, 0% FRL); Glencliff High School (math 0% / reading 6%, grade F, #323 of 332 statewide, top 98%, 1,177 students, 0% FRL) — zoned schools average 0% FRL vs 66% district-wide (66 pts lower); this property's tenant base skews higher-income than the district average.
- Watch-outs: flood insurance adds $427/mo.
- Market conditions: Rents rising (+1.8%/yr); 169 active listings in the ZIP; 6,873 units permitted in Davidson County in 2024 (4,138 in 5+ unit buildings).
- Davidson County population projected at +42% by 2050 — long-run rental-demand tailwind backs the buy-and-hold thesis.
- Climate carrying-cost: in FEMA flood zone AE (mandatory federal flood insurance); extreme-heat days projected 7→20/yr by 2055 (HVAC capex compounding) — expect insurance premiums to compound above CPI over the hold.
- Cap rate 0.6% vs local median 2.9% in Nashville-Davidson metropolitan government (balance) — below-typical yield; the buyer is paying a premium for something (appreciation thesis, condition, location) that the cap rate doesn't capture.
- At $5,997/mo this rent would consume 143% of the median local household income ($50k/yr) (locally 1435% of renters already pay >50% of income on rent) — very limited rent-growth headroom before tenants either downsize or default.
Questions for listing agent
- What do current leases actually rent for vs. the listed asking? Can we see a recent rent roll and the last 12 months of T-12 income?
- Can we see the unit-by-unit rent roll, current vacancy, and any below-market leases? What's the average tenancy length?
- What capital expenditures (roof, boiler, parking lot, exteriors) have been made in the last 5 years, and what's planned in the next 2?
- Built in 1969 — when were the roof, HVAC, electrical panel, plumbing, and water heater last replaced?
- What's the actual annual flood-insurance premium (NFIP or private), and is the property in a SFHA with mandatory coverage?
- Is there a deadline driving the sale (1031 exchange, divorce, estate, relocation)? That informs how much negotiation room exists.
- The area grade is low — what's the realistic commute time and amenity access for the typical tenant pool here? Any planned neighborhood developments (good or bad) we should know about?
- What's the average days-on-market for RENTAL listings here right now (not sales)? A rising rental-DOM trend means longer vacancies and softer asking-rent achievability than the comps imply.
CashFlowRE · CFR-8FS46C8RYBSHVS
· Data 2 days ago
cashflowre.app · 2026-05-29