 Triplex
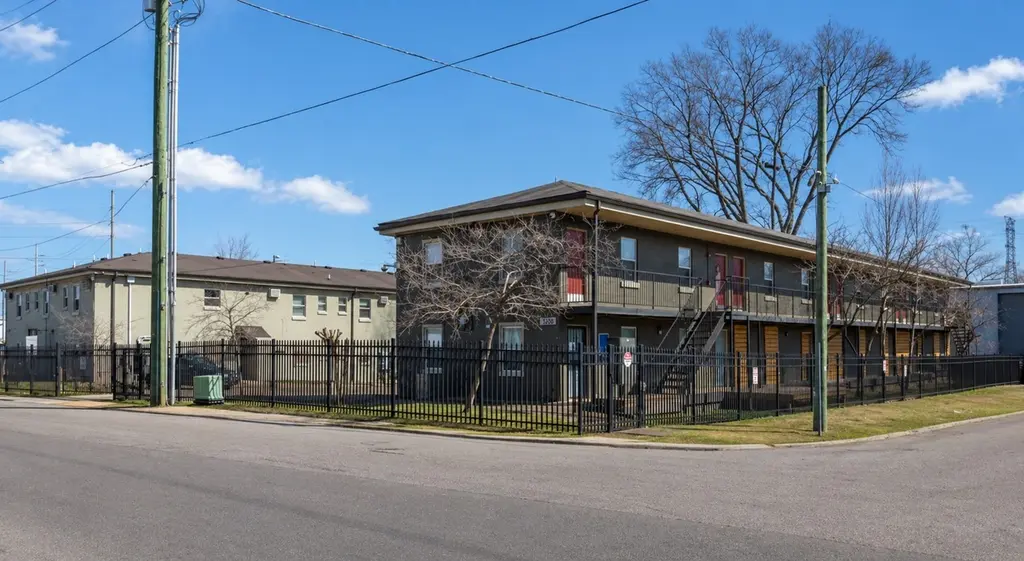
1216 Lewis St · Nashville-Davidson metropolitan government (balance), TN
Flood risk 9/10 · Severe
- FEMA flood zone
- AE
- Chance of flooding over 30 yrs
- 0.99%
- Est. flood insurance / yr
- $1,737 – $8,500
Fire risk 1/10 · Minimal
- Est. fire insurance / yr
- $949 – $1,763
Heat risk 6/10 · Moderate
- Hot days now (above 106°F)
- 7 days/yr
- Hot days in 30 yrs
- 20 days/yr
Wind risk 4/10 · Minor
- Chance of severe wind over 30 yrs
- 9.0%
Air-quality risk 2/10 · Minimal
- Unhealthy air days now
- 1 days/yr
- Unhealthy air days in 30 yrs
- 2 days/yr
Risk factors via First Street. Map © Google.
Why this score? — see what drove the F grade
The composite is a weighted blend of 9 inputs, each scored 0–100. Each bar is that input's sub-score; the figure is the points it added to the 100-point composite (weight × sub-score).
- ARV discount +7.5/15.0
- Rent growth +2.9/5.0
- Livability +2.5/5.0
- Condition / age +2.5/5.0
- Schools +1.4/10.0
- Cash flow +0.0/30.0
- 1% rule +0.0/10.0
- DSCR +0.0/10.0
- Appreciation +0.0/10.0
$2,535,000
🖨 Deal sheet 📄 Offer letter ✓ Due diligence
Multi-family units
County records classify this as Multi-Family (5+ Unit). Listing-text estimate: 3 units. estimate disagrees with records
5+ unit building — per-unit beds/baths from public records are typically unavailable; the breakdown below (if shown) is an estimate from the listing text.
Listing remarks
SVN | Accel Commercial Real Estate is pleased to present Chestnut Flats — a 39-unit, high-upside value-add multifamily opportunity located at 1216–1220 Lewis Street in Nashville, Tennessee. Positioned in the rapidly transforming Chestnut Hill submarket within the 37210 zip code, the property offers investors a rare opportunity to acquire a partially offline asset with significant operational and physical upside just minutes from Downtown Nashville. Originally constructed in 1959 and 1969, Chestnut Flats consists of two buildings situated on 0.66 acres, providing a manageable scale for repositioning in one of the city’s most active infill corridors. With 19 of 39 units curr
Key facts
- 0.64 acre lot
- Built 1969
- Listed 17 days
Tags
Property features AI
Finance
- Other: Zoned Iwd, Ovly
- Financial info: 39 total units; Gross income reported at $42,929; Net operating income reported at $38,202; Owner pays gas; tenants pay water
Exterior
- Utilities: Public water; Public sewer; Water available
- Home design: Residential income property; Attached multi-family building; Two levels
- Construction: Insulated Concrete Forms (ICFs) construction
- Exterior features: Public water available; Public sewer
Interior
- Bedrooms: One-bedroom units (multiple units)
- Flooring: Bamboo
- Bathrooms: One-bathroom units (multiple units)
- Heating & cooling: Central heating; Central air
- Interior features: Bamboo flooring; Central heating; Central air conditioning
Neighborhood map
What this means for you Summary
Snapshot
- This is a 3 × 2-bed/2-bath units multifamily listed at $2.54M.
Deal economics
- At list price, monthly cash flow is $-12k ($-149k/yr) — negative. Per door: $-4k/mo.
- To cash-flow at today's rent, offer at most $568k (77.6% below list).
- To meet the 1% rule (rent ≥ 1% of price), the offer needs to be $600k (76.3% below list).
- Recommended offer: $568k (77.6% below list) — sets the bar for cash-flow.
- Cap rate 0.6% vs local median 2.9% in Nashville-Davidson metropolitan government (balance) — below-typical yield; the buyer is paying a premium for something (appreciation thesis, condition, location) that the cap rate doesn't capture.
Location & tenants
- Location reads: area grade F — affects rentability + tenant quality, not the cash-flow math above.
- Davidson County (urban): math 12% / reading 19% proficiency, ranked #126 of 139 in TN (top 91%) — low school quality limits family demand, transient renter base, plan for 1-2y turnover; 66% free/reduced lunch — lower-income household profile, screen leases tightly.
- Zoned schools: John B. Whitsitt Elementary (math 2% / reading 8%, grade F, #896 of 952 statewide, top 96%, 484 students, 0% FRL); Glencliff High School (math 0% / reading 6%, grade F, #323 of 332 statewide, top 98%, 1,177 students, 0% FRL) — zoned schools average 0% FRL vs 66% district-wide (66 pts lower); this property's tenant base skews higher-income than the district average.
- Market conditions: Rents rising (+1.8%/yr); 169 active listings in the ZIP; 6,873 units permitted in Davidson County in 2024 (4,138 in 5+ unit buildings).
- At $5,997/mo this rent would consume 143% of the median local household income ($50k/yr) (locally 1435% of renters already pay >50% of income on rent) — very limited rent-growth headroom before tenants either downsize or default.
Forward outlook
- Local home prices are declining (-3.0%/yr); year-one equity from $18k of loan paydown is wiped out by about $76k of value loss. Plan a longer hold.
- Davidson County population projected at +42% by 2050 — long-run rental-demand tailwind backs the buy-and-hold thesis.
Negotiation context
- It's been on market 17 days — a 2% lower offer ($2.50M) is reasonable based on typical stale-listing flexibility.
Risks & watch-outs
- Watch-outs: flood insurance adds $427/mo.
- Climate carrying-cost: in FEMA flood zone AE (mandatory federal flood insurance); extreme-heat days projected 7→20/yr by 2055 (HVAC capex compounding) — expect insurance premiums to compound above CPI over the hold.
Questions for the listing agent
- What do current leases actually rent for vs. the listed asking? Can we see a recent rent roll and the last 12 months of T-12 income?
- Can we see the unit-by-unit rent roll, current vacancy, and any below-market leases? What's the average tenancy length?
- What capital expenditures (roof, boiler, parking lot, exteriors) have been made in the last 5 years, and what's planned in the next 2?
- Built in 1969 — when were the roof, HVAC, electrical panel, plumbing, and water heater last replaced?
- What's the actual annual flood-insurance premium (NFIP or private), and is the property in a SFHA with mandatory coverage?
- Is there a deadline driving the sale (1031 exchange, divorce, estate, relocation)? That informs how much negotiation room exists.
- The area grade is low — what's the realistic commute time and amenity access for the typical tenant pool here? Any planned neighborhood developments (good or bad) we should know about?
- What's the average days-on-market for RENTAL listings here right now (not sales)? A rising rental-DOM trend means longer vacancies and softer asking-rent achievability than the comps imply.
- What's the recent tenant-quality profile in this submarket — average credit score on applications, eviction rate, late-payment / NSF rate, and stable-employment percentage? A property-management company in the area should have these aggregated.
- How much new apartment / multifamily construction is in the pipeline within 1–3 miles? Heavy new supply (>2% of stock underway) typically softens rents 12–24 months out; light construction supports rent growth.
Investment metrics
- 1% rule
- 0.24% ✗
- Cap rate
- 0.62%
- Cash-on-cash
- -20.25%
- DSCR
- 0.10
- GRM
- 35.2
CMA / ARV
No comps found within radius.
Projected returns pro-forma
-3.0% appreciation · 1.78% rent growth · sell at horizon
- IRR
- -61.4%
- Equity multiple
- -0.70×
- Total profit
- $-1,208,226
- Equity at exit
- $377,977
- IRR
- —
- Equity multiple
- -1.96×
- Total profit
- $-2,099,090
- Equity at exit
- $219,180
Cash invested: $709,800 (down + closing). Projections, not guarantees.
Landlord ↔ Tenant lean methodology
- Overall (STATE)
- 87 Strongly Landlord-Friendly
- State Tennessee
- 87 Strongly Landlord-Friendly · R+13
- County
- — inherits STATE
- City
- — inherits STATE
ZIP-level market 37210
- Home prices YoY
- -22.6%
- Rents YoY
- 1.8%
- Active inventory
- 169
- Price-to-rent
- 105.7×
Monthly cashflow live
- Estimated rent
- $5,997 medium interval (Pro) →
- Mortgage (P&I)
- −$13,294
- Tax from tax record
- −$2,365 /mo · $28,383/yr
- Insurance
- −$1,056
- Flood insurance flood zone
- −$427 /mo · $5,118/yr
- HOA
- −$0
- Vacancy / Maint / Mgmt
- −$1,259
- Net cashflow
- $-12,404
Break-even live
3-unit breakdown (identical units grouped — click to expand)
| Units | Beds | Baths | Est. rent |
|---|---|---|---|
| 3× units | 2 | 2 | $5,997 |
| #1 | 2 | 2 | $1,999 |
| #2 | 2 | 2 | $1,999 |
| #3 | 2 | 2 | $1,999 |
| Total (3 units) | $5,997 | ||
UW: 25.0% down · 7.5% · 30yr · 1.5% tax · 5.0% vac · 8.0% maint · 8.0% mgmt
Financing live
Cash to close
- Down payment
- $633,750
- Closing costs
- $76,050
- Reserves months
- —
- Total cash needed
- —
Loan-product check · same deal, 3 products live
Conventional
25% down · 7.5% · 30yr
- Down + closing
- —
- Monthly P&I
- —
- Monthly cashflow
- —
- DSCR
- —
- Eligible?
- —
Personal DTI + credit; lowest rate.
DSCR
20% down · 8.5% · 30yr
- Down + closing
- —
- Monthly P&I
- —
- Monthly cashflow
- —
- DSCR
- —
- Eligible?
- —
No personal income docs; deal must DSCR.
Hard money
10% down · 12.0% · 12mo
- Down + closing
- —
- Monthly P&I
- —
- Monthly cashflow
- —
- DSCR
- —
- Eligible?
- —
Short-term bridge; refi at stabilization.
Listing history 13 events
-
2026-06-18days on market $2,535,000 Active 17 DOM
-
2026-06-17days on market $2,535,000 Active 16 DOM
-
2026-06-16days on market $2,535,000 Active 15 DOM
-
2026-06-15days on market $2,535,000 Active 14 DOM
-
2026-06-13days on market $2,535,000 Active 12 DOM
-
2026-06-13days on market $2,535,000 Active 11 DOM
-
2026-06-09days on market $2,535,000 Active 8 DOM
-
2026-06-08days on market $2,535,000 Active 7 DOM
-
2026-06-07days on market $2,535,000 Active 6 DOM
-
2026-06-05days on market $2,535,000 Active 3 DOM
-
2026-06-03days on market $2,535,000 Active 2 DOM
-
2026-06-02remarks 681-char remark
-
2026-06-02$2,535,000 Active 1 DOM
ⓘ Source: listings_history table (triggers on properties + properties_extension) + one-shot
backfill from property_details.listing_events for pre-trigger history.
Tax reassessment forecast TN · Resets to sale price
- Current annual tax
- $28,383 · $2,365/mo
- Projected year-2 tax
- $28,383 · $2,365/mo
- Expected delta
- $0/yr ($0/mo · 0.0%)
ⓘ Screening estimate from a state-policy table — verify with the county assessor before closing.
Climate risk First Street
- Flood 9/10 Extreme FEMA zone AE · 99% chance over 30 yrs
- Wildfire 1/10 Low
- Heat 6/10 Major 7 d/yr ≥106°F today · 20 d/yr by 30 yrs out
- Wind 4/10 Moderate 9% chance of damaging wind over 30 yrs
- Air quality 2/10 Low 1 unhealthy d/yr today · 2 by 30 yrs out
Nearby sold comps map
Loading sold comps map…
Walkable amenities ~0.75 mi
Loading nearby amenities…
Taxation est. · year 1
- Rental income
- $71,964
- − Mortgage interest
- −$141,999
- − Property taxes
- −$28,383
- − Insurance
- −$17,794
- − Repairs & maintenance
- −$5,757
- − Management
- −$5,757
- − Depreciation
- −$73,745
- Taxable loss
- −$201,472
- Est. tax savings @ 24.0%
- +$48,353
- After-tax cash flow
- $-100,498/yr
For passive investors: Depreciation is non-cash, so a rental often shows a tax loss while cash-flowing — sheltering income. Rental losses are passive: they offset passive income freely, and up to $25,000/yr can offset ordinary (W-2) income if you actively participate and your MAGI is under $100k (phasing out to $0 by $150k); unused losses carry forward. On sale, claimed depreciation is recaptured at up to 25%, and gains may owe capital-gains tax (a 1031 exchange can defer both). Figures are a year-1 estimate at your 24.0% rate — not tax advice; consult a CPA.
Schools (NCES district)
- District
- Davidson County
- NCES district ID
- 4703180
- Math proficiency
- 12% ▼ -17.00%
- Reading proficiency
- 19% ▼ -7.00%
- Median HH income
- $48,667
- Composite
- 14.03/100
- National rank
- #9472
- State rank
- #126 of 139 in TN
Livability — Nashville-Davidson metropolitan government (balance)
No livability data for this city. (Only ~50 U.S. cities are tracked.)
Census & demographics
- Census place
- Nashville-Davidson metropolitan government (balance), TN
- County
- Davidson County · 680,067 people
- City population
- 677,595
- Metro
- Nashville-Davidson--Murfreesboro--Franklin, TN
- Population (ZIP)
- 17,725
- Household income
- $50,284
- Rent vs Own
- Severe rent burden
- 1435.0
Population outlook (Davidson County) Hauer SSP2
- Today (2025)
- 808,568 people
- By 2030
- 874,489 · +8.2%
- By 2040
- 1,009,046 · +24.8%
- By 2050
- 1,147,294 · +41.9%
- By 2075
- 1,475,439 · +82.5%
- By 2100
- 1,714,101 · +112.0%
Race, ethnicity, and origin ACS 2023
- Neighborhood character
- Highly diverse neighborhood (Simpson 0.70)
- Race & ethnicity
- White 40% Black 31% Hispanic / Latino 19% Two or more races 11% Asian 3%
- Hispanic origin (detail)
- Mexican 9% Puerto Rican 4%
- Common ancestry
- Slovak 1% Romanian 1% Serbian 1%
- Foreign-born
- 15% · Canada, China, South Korea
- Languages at home
- 80% English-only · Spanish 14% Other Asian/Pacific 1% Chinese 1%
Political lean MEDSL · Davidson
- 2024 margin
- Strong D (+27.4) · D 62.7% · R 35.3% · Other 2.0%
- 2008→2024 swing
- +6.5pp toward D · 2008: 21.0pp · 2024: 27.4pp
- All cycles
- 2024: D+27.4 2020: D+32.1 2016: D+26.0 2012: D+18.7 2008: D+21.0
Not yet ingested
- Civics
- —
Market trends
- HPI YoY
- ▼ -111.00%
- Current HPI
- 379.1401
- Rent YoY
- ▲ 1.78%
- Metro
- Nashville-Davidson--Murfreesboro--Franklin, TN
- State GDP YoY
- ▲ 2.78%
- F500 in state
- 22
Industry mix (Fortune 500 HQ in TN)
| Industry | F500 HQs | Revenue |
|---|---|---|
| Healthcare | 3 | $91B |
|
||
| Retail | 3 | $72B |
|
||
| Transportation / Logistics | 1 | $88B |
|
||
| Paper / Packaging | 1 | $19B |
|
||
| Insurance | 1 | $13B |
|
||
| Energy | 1 | $12B |
|
||
Price history
+2435.0% since first listed15 events — show timeline
- 2026-06-01 Listed $2,535,000 REALTRACS as Distributed by MLS Grid
- 2025-09-26 Sold (Public Records) $3,710,000 Public Records
- 2025-09-26 Sold (Public Records) $3,710,000 Public Records
- 2011-09-12 Sold (Public Records) $866,250 Public Records
- 2003-10-29 Sold (Public Records) $78,300 Public Records
- 1991-04-01 Sold (Public Records) $75,000 Public Records
- 1986-07-01 Sold (Public Records) $326,013 Public Records
- 1982-01-01 Sold (Public Records) $395,000 Public Records
- 1981-09-01 Sold (Public Records) $395,000 Public Records
- 1981-09-01 Sold (Public Records) $395,000 Public Records
- 1979-10-01 Sold (Public Records) $155,666 Public Records
- 1979-05-01 Sold (Public Records) $153,627 Public Records
- 1978-08-01 Sold (Public Records) $146,795 Public Records
- 1977-12-01 Sold (Public Records) $145,000 Public Records
- 1977-09-01 Sold (Public Records) $100,000 Public Records
Property tax history
+4.4%/yrLatest (2025): $28,383 · +34.1% YoY. Source: county tax records.
Cash-flow waterfall
monthlySold comps — $/sqft
last 12 mo · ≤1 miLoading sold comps…