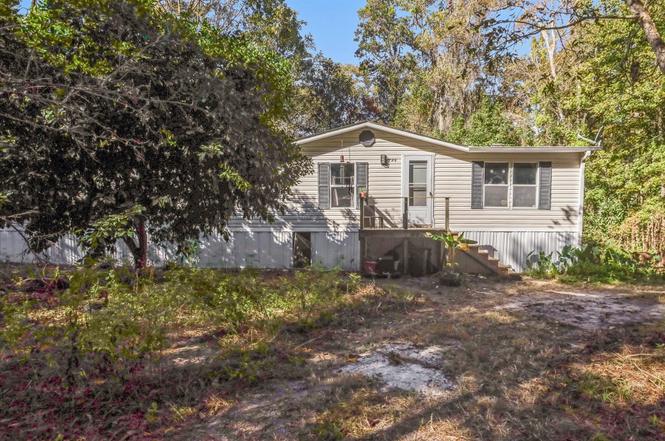
728 Sir Richard Rd
Fort Braden, FL 32310
$125,000C
3 bd · 2.0 ba ·
1,620 sqft ·
Built 1997
· Manufactured
· Active
· 210 DOM
Cashflow @ list (25.0% down · 7.5%)
Estimated rent
$1,453/mo
Mortgage (P&I)
−$656
Tax + insurance
−$157
HOA
−$0
Vac / Maint / Mgmt
−$305
Net cashflow
$335/mo
Annual
$4,019/yr
Cap rate
9.51%
Cash-on-cash
11.48%
DSCR
1.51
1% rule
1.16%
Cash to close
$35,000
Investor read
- This is a 3-bed/2.0-bath manufactured listed at $125k.
- At list price, monthly cash flow is $335 ($4k/yr) — positive.
- The deal already cash-flows at list — no discount required.
- Meets the 1% rule at list price ($1k rent vs $125k).
- It's been on market 210 days — a 12% lower offer ($110k) is reasonable based on typical stale-listing flexibility.
- Recommended offer: $110k (12.0% below list) — sets the bar for market timing.
- In year one you build about $188 of equity ($864 loan paydown + $-676 appreciation (-0.5% local appreciation)).
- Location reads: area grade C — affects rentability + tenant quality, not the cash-flow math above.
- Leon (urban): math 48% / reading 53% proficiency, ranked #33 of 73 in FL (top 45%) — acceptable for families but not a draw, mixed tenant base, ~2y average lease.
- Market conditions: 94 active listings in the ZIP; lower-income renter base — watch delinquency; 1,765 units permitted in Leon County in 2024 (975 in 5+ unit buildings).
- Leon County population projected at +23% by 2050 — long-run rental-demand tailwind backs the buy-and-hold thesis.
- 3 sale attempts since 18y ago with the ask held roughly flat each time — persistent listings suggest the price (not the market) is what's stuck; bring a comps-based counter.
- At projected returns (-0.5% appreciation + 3.0% rent growth), your $35k cash investment doubles in ~7 years — after that, you're playing with house money.
- Climate carrying-cost: severe wind risk, 99% chance of damaging wind over 30y; major wildfire risk; extreme-heat days projected 7→20/yr by 2055 (HVAC capex compounding) — expect insurance premiums to compound above CPI over the hold.
- Cap rate 9.5% vs local median 2.6% in Fort Braden — top-decile yield for the area; either an underpriced asset or a hidden risk that comps aren't pricing in. Stress-test before assuming the spread holds.
- At $1,453/mo this rent would consume 46% of the median local household income ($38k/yr) (locally 1272% of renters already pay >50% of income on rent) — very limited rent-growth headroom before tenants either downsize or default.
Questions for listing agent
- It's been on market 210 days. Have you received any prior offers? Is the seller open to a 12% concession, seller financing, or rate buy-down credit?
- Why hasn't it sold? Are there any deal-killer items the seller is aware of (foundation, flood, title, zoning, code violations)?
- Is there a deadline driving the sale (1031 exchange, divorce, estate, relocation)? That informs how much negotiation room exists.
- What's the average days-on-market for RENTAL listings here right now (not sales)? A rising rental-DOM trend means longer vacancies and softer asking-rent achievability than the comps imply.
- What's the recent tenant-quality profile in this submarket — average credit score on applications, eviction rate, late-payment / NSF rate, and stable-employment percentage? A property-management company in the area should have these aggregated.
- How much new for-sale + rental construction is in the pipeline within 1–3 miles? Heavy new supply typically softens prices + rents 12–24 months out; constrained supply supports both.
CashFlowRE · CFR-8HWS12DP97P7YM
· Data 2 days ago
cashflowre.app · 2026-05-29