728 Sir Richard Rd · Fort Braden, FL
Flood risk 1/10 · Minimal
- FEMA flood zone
- X (unshaded)
- Chance of flooding over 30 yrs
- 0.0%
- Est. flood insurance / yr
- $507 – $1,088
Fire risk 6/10 · Moderate
- Est. fire insurance / yr
- $947 – $1,759
Heat risk 8/10 · Major
- Hot days now (above 108°F)
- 7 days/yr
- Hot days in 30 yrs
- 20 days/yr
Wind risk 9/10 · Severe
- Chance of severe wind over 30 yrs
- 99.0%
Air-quality risk 5/10 · Moderate
- Unhealthy air days now
- 7 days/yr
- Unhealthy air days in 30 yrs
- 8 days/yr
Risk factors via First Street. Map © Google.
Why this score? — see what drove the C grade
The composite is a weighted blend of 9 inputs, each scored 0–100. Each bar is that input's sub-score; the figure is the points it added to the 100-point composite (weight × sub-score).
- Cash flow +26.6/30.0
- DSCR +9.1/10.0
- 1% rule +6.6/10.0
- Appreciation +4.7/10.0
- Schools +4.3/10.0
- Rent growth +2.5/5.0
- Livability +2.5/5.0
- Condition / age +2.5/5.0
- ARV discount +0.0/15.0
$125,000
🖨 Deal sheet 📄 Offer letter ✓ Due diligence
Listing remarks MLS
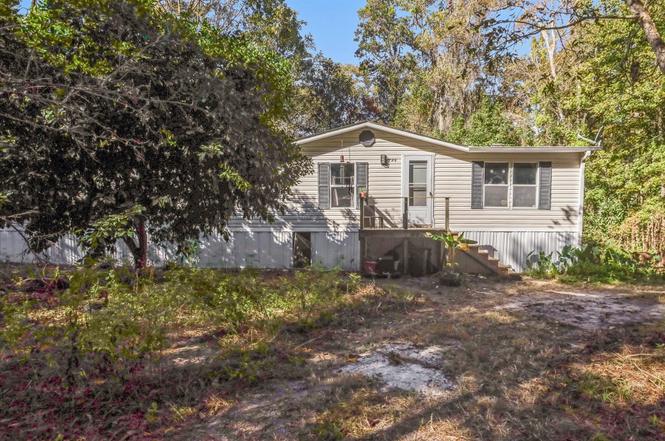
This home is a beautiful double wide and sits a little over 2 acres. It is a 3 bed/ 2 bath.
Key facts
- Private land
- Newer updates
- Fruit bearing trees
Tags
Property features AI
Finance
- Other: For sale
Exterior
- Parking: Driveway
- Utilities: Septic tank
- Home design: Single-story; Vinyl siding; Crawlspace foundation
- Construction: Vinyl siding construction
- Exterior features: 2.5-acre lot; Unimproved road access
Interior
- Kitchen: Dishwasher; Icemaker; Microwave; Oven; Range; Refrigerator; Kitchen (14x14)
- Bedrooms: Bedroom 2 (12x12); Bedroom 3 (10x12)
- Bathrooms: 2 full bathrooms
- Heating & cooling: Central heating; Electric heating; Wood heating; Central air conditioning; Ceiling fans; Electric cooling
- Interior features: Split bedrooms; Fireplace
Neighborhood map
What this means for you Summary
Snapshot
- This is a 3-bed/2.0-bath manufactured listed at $125k.
Deal economics
- At list price, monthly cash flow is $335 ($4k/yr) — positive.
- The deal already cash-flows at list — no discount required.
- Meets the 1% rule at list price ($1k rent vs $125k).
- Recommended offer: $110k (12.0% below list) — sets the bar for market timing.
- Cap rate 9.5% vs local median 2.6% in Fort Braden — top-decile yield for the area; either an underpriced asset or a hidden risk that comps aren't pricing in. Stress-test before assuming the spread holds.
Location & tenants
- Location reads: area grade C — affects rentability + tenant quality, not the cash-flow math above.
- Leon (urban): math 48% / reading 53% proficiency, ranked #33 of 73 in FL (top 45%) — acceptable for families but not a draw, mixed tenant base, ~2y average lease.
- Market conditions: 94 active listings in the ZIP; lower-income renter base — watch delinquency; 1,765 units permitted in Leon County in 2024 (975 in 5+ unit buildings).
- At $1,453/mo this rent would consume 46% of the median local household income ($38k/yr) (locally 1272% of renters already pay >50% of income on rent) — very limited rent-growth headroom before tenants either downsize or default.
Forward outlook
- In year one you build about $188 of equity ($864 loan paydown + $-676 appreciation (-0.5% local appreciation)).
- Leon County population projected at +23% by 2050 — long-run rental-demand tailwind backs the buy-and-hold thesis.
- At projected returns (-0.5% appreciation + 3.0% rent growth), your $35k cash investment doubles in ~7 years — after that, you're playing with house money.
Negotiation context
- It's been on market 210 days — a 12% lower offer ($110k) is reasonable based on typical stale-listing flexibility.
- 3 sale attempts since 18y ago with the ask held roughly flat each time — persistent listings suggest the price (not the market) is what's stuck; bring a comps-based counter.
Risks & watch-outs
- Climate carrying-cost: severe wind risk, 99% chance of damaging wind over 30y; major wildfire risk; extreme-heat days projected 7→20/yr by 2055 (HVAC capex compounding) — expect insurance premiums to compound above CPI over the hold.
Questions for the listing agent
- It's been on market 210 days. Have you received any prior offers? Is the seller open to a 12% concession, seller financing, or rate buy-down credit?
- Why hasn't it sold? Are there any deal-killer items the seller is aware of (foundation, flood, title, zoning, code violations)?
- Is there a deadline driving the sale (1031 exchange, divorce, estate, relocation)? That informs how much negotiation room exists.
- What's the average days-on-market for RENTAL listings here right now (not sales)? A rising rental-DOM trend means longer vacancies and softer asking-rent achievability than the comps imply.
- What's the recent tenant-quality profile in this submarket — average credit score on applications, eviction rate, late-payment / NSF rate, and stable-employment percentage? A property-management company in the area should have these aggregated.
- How much new for-sale + rental construction is in the pipeline within 1–3 miles? Heavy new supply typically softens prices + rents 12–24 months out; constrained supply supports both.
Investment metrics
- 1% rule
- 1.16% ✓
- Cap rate
- 9.51%
- Cash-on-cash
- 11.48%
- DSCR
- 1.51
- GRM
- 7.2
CMA / ARV
- ARV (on-the-fly)
- $89,100
- Comps found
- 1
Show comp detail 1 sale within ~0.75 mi
| Address | Dist | Beds/Ba | Sqft | Sold | Price | $/sf | Match |
|---|---|---|---|---|---|---|---|
| 833 Sir Richard Rd | 0.36mi | 3/2.0 | 1,456 (-10%) | 6mo | $79,900 | $55 | 62 |
Match score weights: distance 35% · size 25% · config 20% · recency 20%. Top-matched comps best support the ARV.
Projected returns pro-forma
-0.54% appreciation · 3.0% rent growth · sell at horizon
- IRR
- 9.0%
- Equity multiple
- 1.41×
- Total profit
- $14,519
- Equity at exit
- $32,950
- IRR
- 14.6%
- Equity multiple
- 2.51×
- Total profit
- $53,002
- Equity at exit
- $37,027
Cash invested: $35,000 (down + closing). Projections, not guarantees.
Landlord ↔ Tenant lean methodology
- Overall (STATE)
- 87 Strongly Landlord-Friendly
- State Florida
- 87 Strongly Landlord-Friendly · R+3
- County
- — inherits STATE
- City
- — inherits STATE
ZIP-level market 32310
- Home prices YoY
- -0.2%
- Active inventory
- 94
- Price-to-rent
- 7.2×
Monthly cashflow live
- Estimated rent
- $1,453 medium interval (Pro) →
- Mortgage (P&I)
- −$656
- Tax from tax record
- −$105 /mo · $1,263/yr
- Insurance
- −$52
- HOA
- −$0
- Vacancy / Maint / Mgmt
- −$305
- Net cashflow
- $335
Break-even live
UW: 25.0% down · 7.5% · 30yr · 1.5% tax · 5.0% vac · 8.0% maint · 8.0% mgmt
Financing live
Cash to close
- Down payment
- $31,250
- Closing costs
- $3,750
- Reserves months
- —
- Total cash needed
- —
Loan-product check · same deal, 3 products live
Conventional
25% down · 7.5% · 30yr
- Down + closing
- —
- Monthly P&I
- —
- Monthly cashflow
- —
- DSCR
- —
- Eligible?
- —
Personal DTI + credit; lowest rate.
DSCR
20% down · 8.5% · 30yr
- Down + closing
- —
- Monthly P&I
- —
- Monthly cashflow
- —
- DSCR
- —
- Eligible?
- —
No personal income docs; deal must DSCR.
Hard money
10% down · 12.0% · 12mo
- Down + closing
- —
- Monthly P&I
- —
- Monthly cashflow
- —
- DSCR
- —
- Eligible?
- —
Short-term bridge; refi at stabilization.
Listing history 25 events
-
2026-06-18days on market $125,000 Active 210 DOM
-
2026-06-17days on market $125,000 Active 209 DOM
-
2026-06-16days on market $125,000 Active 208 DOM
-
2026-06-15days on market $125,000 Active 207 DOM
-
2026-06-14days on market $125,000 Active 205 DOM
-
2026-06-10days on market $125,000 Active 202 DOM
-
2026-06-09days on market $125,000 Active 201 DOM
-
2026-06-08days on market $125,000 Active 200 DOM
-
2026-06-07days on market $125,000 Active 199 DOM
-
2026-06-05days on market $125,000 Active 196 DOM
-
2026-06-03days on market $125,000 Active 195 DOM
-
2026-06-02days on market $125,000 Active 194 DOM
-
2026-06-01days on market $125,000 Active 193 DOM
-
2026-05-31pricedays on market $125,000 Active 192 DOM
-
2026-05-30days on market $130,000 Active 191 DOM
-
2025-11-20$130,000 Active
-
2022-04-22soldstatus $122,000 Closed 91-char remark
Show marketing remark (91 chars)
This home is a beautiful double wide and sits a little over 2 acres. It is a 3 bed/ 2 bath.
-
2022-04-22soldstatus $122,000
Show marketing remark (91 chars)
This home is a beautiful double wide and sits a little over 2 acres. It is a 3 bed/ 2 bath.
-
2022-03-15historical Active Under Contract 91-char remark
Show marketing remark (91 chars)
This home is a beautiful double wide and sits a little over 2 acres. It is a 3 bed/ 2 bath.
-
2022-03-07price $120,000 91-char remark
Show marketing remark (91 chars)
This home is a beautiful double wide and sits a little over 2 acres. It is a 3 bed/ 2 bath.
-
2022-02-13$140,000 Active 91-char remark
Show marketing remark (91 chars)
This home is a beautiful double wide and sits a little over 2 acres. It is a 3 bed/ 2 bath.
-
2008-08-01soldstatus $59,900
-
2008-07-31soldstatus $59,900 519-char remark
Show marketing remark (519 chars)
Peaceful country living 1 mile from Lake Talquin, a great area for sportsmen and nature lovers. Close to Ft. Braden elementary school and public library. Plenty of room in this Doublewide MH on 2.5 acres for a growing family. Spacious open living area has lots of windows making it bright and airy. Kitchen overlooks great room and FP & has lots of storage & work surfaces, including a work island. Convenient split plan provides privacy to master bedroom suite with enormous walk in closets. Make an offer!
-
2008-06-12$59,900 519-char remark
Show marketing remark (519 chars)
Peaceful country living 1 mile from Lake Talquin, a great area for sportsmen and nature lovers. Close to Ft. Braden elementary school and public library. Plenty of room in this Doublewide MH on 2.5 acres for a growing family. Spacious open living area has lots of windows making it bright and airy. Kitchen overlooks great room and FP & has lots of storage & work surfaces, including a work island. Convenient split plan provides privacy to master bedroom suite with enormous walk in closets. Make an offer!
-
2004-12-02soldstatus $99,000
ⓘ Source: listings_history table (triggers on properties + properties_extension) + one-shot
backfill from property_details.listing_events for pre-trigger history.
Tax reassessment forecast FL · Resets to sale price
- Current annual tax
- $1,263 · $105/mo
- Projected year-2 tax
- $1,263 · $105/mo
- Expected delta
- $0/yr ($0/mo · 0.0%)
ⓘ Screening estimate from a state-policy table — verify with the county assessor before closing.
Climate risk First Street
- Flood 1/10 Low FEMA zone X (unshaded) · 0% chance over 30 yrs
- Wildfire 6/10 Major
- Heat 8/10 Severe 7 d/yr ≥108°F today · 20 d/yr by 30 yrs out
- Wind 9/10 Extreme 99% chance of damaging wind over 30 yrs
- Air quality 5/10 Major 7 unhealthy d/yr today · 8 by 30 yrs out
Nearby sold comps map
Loading sold comps map…
Walkable amenities ~0.75 mi
Loading nearby amenities…
Taxation est. · year 1
- Rental income
- $17,434
- − Mortgage interest
- −$7,002
- − Property taxes
- −$1,263
- − Insurance
- −$625
- − Repairs & maintenance
- −$1,395
- − Management
- −$1,395
- − Depreciation
- −$3,636
- Taxable income
- $2,118
- Est. tax owed @ 24.0%
- −$508
- After-tax cash flow
- $3,510/yr
For passive investors: Depreciation is non-cash, so a rental often shows a tax loss while cash-flowing — sheltering income. Rental losses are passive: they offset passive income freely, and up to $25,000/yr can offset ordinary (W-2) income if you actively participate and your MAGI is under $100k (phasing out to $0 by $150k); unused losses carry forward. On sale, claimed depreciation is recaptured at up to 25%, and gains may owe capital-gains tax (a 1031 exchange can defer both). Figures are a year-1 estimate at your 24.0% rate — not tax advice; consult a CPA.
Schools (NCES district)
- District
- Leon
- NCES district ID
- 1201110
- Math proficiency
- 48% ▼ -13.00%
- Reading proficiency
- 53% ▼ -5.00%
- Median HH income
- $46,339
- Composite
- 42.84/100
- National rank
- #3131
- State rank
- #33 of 73 in FL
Livability — Fort Braden
No livability data for this city. (Only ~50 U.S. cities are tracked.)
Census & demographics
- Census place
- Fort Braden, FL
- County
- Leon County · 294,472 people
- Metro
- Tallahassee, FL
- Population (ZIP)
- 14,888
- Household income
- $38,288
- Rent vs Own
- Severe rent burden
- 1272.0
Population outlook (Leon County) Hauer SSP2
- Today (2025)
- 315,507 people
- By 2030
- 330,677 · +4.8%
- By 2040
- 358,465 · +13.6%
- By 2050
- 386,804 · +22.6%
- By 2075
- 465,480 · +47.5%
- By 2100
- 519,959 · +64.8%
Race, ethnicity, and origin ACS 2023
- Neighborhood character
- Diverse neighborhood (Simpson 0.61)
- Race & ethnicity
- Black 50% White 36% Hispanic / Latino 9% Two or more races 5%
- Hispanic origin (detail)
- Mexican 3%
- Common ancestry
- Italian 1% Lithuanian 1% Slovak 1%
- Foreign-born
- 4% · Canada
- Languages at home
- 92% English-only · Spanish 6% French/Haitian/Cajun 1% German/W. Germanic 1%
Political lean MEDSL · Leon
- 2024 margin
- Strong D (+21.8) · D 60.3% · R 38.5% · Other 1.2%
- 2008→2024 swing
- -2.5pp toward R · 2008: 24.3pp · 2024: 21.8pp
- All cycles
- 2024: D+21.8 2020: D+28.3 2016: D+25.1 2012: D+23.6 2008: D+24.3
Not yet ingested
- Civics
- —
Market trends
- HPI YoY
- ▼ -0.54%
- Current HPI
- 270.5721
- Rent YoY
- —
- Metro
- Tallahassee, FL
- State GDP YoY
- ▲ 3.28%
- F500 in state
- 36
Industry mix (Fortune 500 HQ in FL)
| Industry | F500 HQs | Revenue |
|---|---|---|
| Industrial Technology | 2 | $29B |
|
||
| Insurance | 2 | $17B |
|
||
| Retail | 1 | $60B |
|
||
| Technology Distribution | 1 | $58B |
|
||
| Homebuilding | 1 | $35B |
|
||
| Technology Manufacturing | 1 | $35B |
|
||
Price history
+31.3% since first listed10 events — show timeline
- 2025-11-20 Listed $130,000 CATRS
- 2022-04-22 Sold (Public Records) $122,000 Public Records
- 2022-04-22 Sold (MLS) $122,000 CATRS
- 2022-03-15 Contingent — CATRS
- 2022-03-07 Price Changed $120,000 CATRS
- 2022-02-13 Listed $140,000 CATRS
- 2008-08-01 Sold (Public Records) $59,900 Public Records
- 2008-07-31 Sold (MLS) $59,900 CATRS
- 2008-06-12 Listed $59,900 CATRS
- 2004-12-02 Sold (Public Records) $99,000 Public Records
Property tax history
+10.1%/yrLatest (2025): $1,263 · +2.2% YoY. Source: county tax records.
Cash-flow waterfall
monthlySold comps — $/sqft
last 12 mo · ≤1 miLoading sold comps…