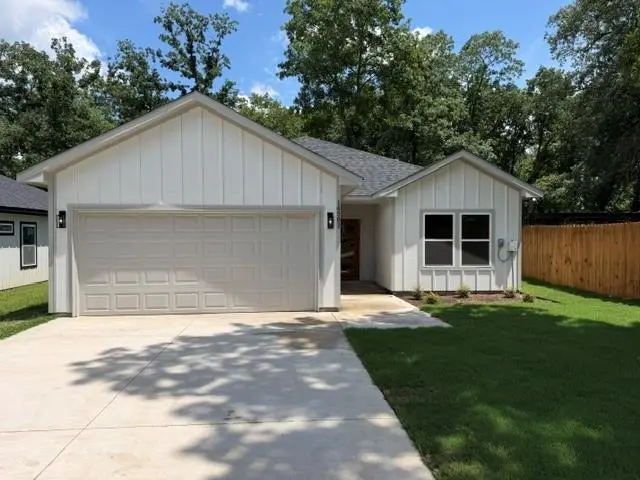
14583 Cherokee Ln
Log Cabin, TX 75148
$242,640D
3 bd · 2.0 ba ·
1,348 sqft ·
Built 2025
· SingleFamily
· Active
· 24 DOM
Cashflow @ list (25.0% down · 7.5%)
Estimated rent
$2,400/mo
Mortgage (P&I)
−$1,272
Tax + insurance
−$404
HOA
−$0
Vac / Maint / Mgmt
−$504
Net cashflow
$219/mo
Annual
$2,630/yr
Cap rate
7.38%
Cash-on-cash
3.87%
DSCR
1.17
1% rule
0.99%
Cash to close
$67,939
Investor read
- This is a 3-bed/2.0-bath single-family listed at $243k. Condition is rated good.
- At list price, monthly cash flow is $219 ($3k/yr) — positive.
- The deal already cash-flows at list — no discount required.
- To meet the 1% rule (rent ≥ 1% of price), the offer needs to be $240k (1.1% below list).
- It's been on market 24 days — a 2% lower offer ($239k) is reasonable based on typical stale-listing flexibility.
- Recommended offer: $239k (1.5% below list) — sets the bar for market timing.
- Local home prices are declining (-3.0%/yr); year-one equity from $2k of loan paydown is wiped out by about $7k of value loss. Plan a longer hold.
- Location reads 38/100 on livability (#1,626 in TX) — a limited-amenity area; tenant pool skews transient or value-seeking. Strengths: cost of living A+, crime A; Watch: amenities F, commute F, employment F.
- Eustace ISD (rural): math 32% / reading 45% proficiency, ranked #455 of 826 in TX (top 55%) — families likely to look elsewhere, expect single-tenant / working-renter base with shorter leases; 62% free/reduced lunch — lower-income household profile, screen leases tightly.
- Zoned schools: Eustace Pri (497 students, 74% FRL); Eustace Middle (math 34% / reading 44%, grade F, #690 of 1,662 statewide, top 42%, 382 students, 63% FRL); Eustace H S (math 22% / reading 57%, grade F, #821 of 1,632 statewide, top 53%, 473 students, 56% FRL) — zoned schools at 64% FRL track the district average.
- Market conditions: 227 active listings in the ZIP; 1 comparable units currently listed for rent nearby; 263 units permitted in Henderson County in 2024 (0 in 5+ unit buildings).
- 2 sale attempts with the ask held roughly flat each time — persistent listings suggest the price (not the market) is what's stuck; bring a comps-based counter.
- Cap rate 7.4% vs local median 0.9% in Log Cabin — top-decile yield for the area; either an underpriced asset or a hidden risk that comps aren't pricing in. Stress-test before assuming the spread holds.
Questions for listing agent
- Is there a deadline driving the sale (1031 exchange, divorce, estate, relocation)? That informs how much negotiation room exists.
- Schools are F-rated, which usually means shorter tenancies and higher turnover. Who's the typical renter profile here, and what's been the actual vacancy rate?
- The area grade is low — what's the realistic commute time and amenity access for the typical tenant pool here? Any planned neighborhood developments (good or bad) we should know about?
- What's the average days-on-market for RENTAL listings here right now (not sales)? A rising rental-DOM trend means longer vacancies and softer asking-rent achievability than the comps imply.
- What's the recent tenant-quality profile in this submarket — average credit score on applications, eviction rate, late-payment / NSF rate, and stable-employment percentage? A property-management company in the area should have these aggregated.
- How much new for-sale + rental construction is in the pipeline within 1–3 miles? Heavy new supply typically softens prices + rents 12–24 months out; constrained supply supports both.
CashFlowRE · CFR-8HZH986CN090KS
· Data 11 h ago
cashflowre.app · 2026-05-29