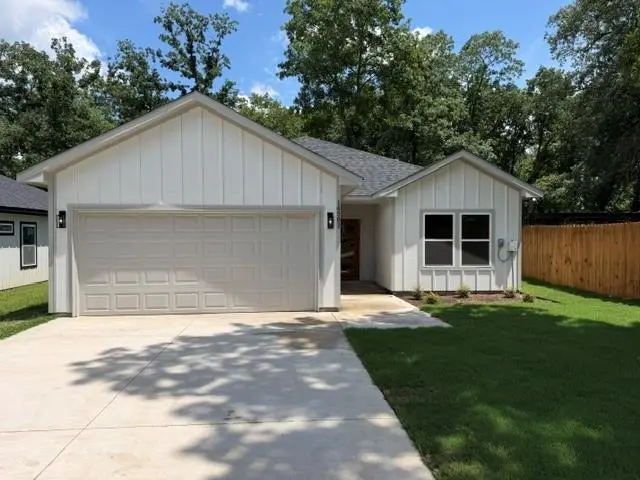
14583 Cherokee Ln · Log Cabin, TX
Flood risk No data
- FEMA flood zone
- —
- Chance of flooding over 30 yrs
- —
- Est. flood insurance / yr
- —
Fire risk No data
- Est. fire insurance / yr
- —
Heat risk No data
- Hot days now (above threshold)
- —
- Hot days in 30 yrs
- —
Wind risk No data
- Chance of severe wind over 30 yrs
- —
Air-quality risk No data
- Unhealthy air days now
- —
- Unhealthy air days in 30 yrs
- —
Risk factors via First Street. Map © Google.
Why this score? — see what drove the D grade
The composite is a weighted blend of 9 inputs, each scored 0–100. Each bar is that input's sub-score; the figure is the points it added to the 100-point composite (weight × sub-score).
- Cash flow +18.2/30.0
- DSCR +5.7/10.0
- 1% rule +4.9/10.0
- Condition / age +4.0/5.0
- Schools +3.2/10.0
- Rent growth +2.5/5.0
- Livability +1.9/5.0
- ARV discount +0.0/15.0
- Appreciation +0.0/10.0
$242,640
🖨 Deal sheet (PDF) 📄 Offer letter ✓ Due diligence
Listing remarks
Escape to the laid-back charm of lake living at this beautiful new build in Log Cabin, Texas! Located just minutes from Cedar Creek Lake, 14583 Cherokee Lane is the perfect summer getaway, weekend retreat, or full-time escape from the city. Enjoy the benefits of brand-new construction, offering modern finishes, fresh design, and low-maintenance living—so you can spend more time enjoying the lake and less time on upkeep. Spend your days boating, fishing, relaxing by the water, and making memories with family and friends. Whether you're looking for peaceful mornings, sunset evenings, or fun-filled weekends at the lake, this property puts you close to it all. Enjoy the small-town lake at
Key facts
- Cedar creek lake
- Lake living
- New build
Tags
Property features AI
Finance
- Financial info: Accepts Cash, Conventional, FHA, and VA financing; No second mortgage
- HOA & community: No homeowners association
Exterior
- Parking: Attached 2-car garage with garage door opener; Covered parking for 2 vehicles; Carport spaces not provided
- Security: Smoke detector(s)
- Utilities: City water; City sewer; Electric service
- Home design: Single family residence; One story; New construction (completed 2025); Residential property
- Construction: Fiber cement exterior; Shingle roof; Slab foundation; Year built 2025 (new construction - complete)
- Exterior features: Wood fencing; Few trees on lot
Interior
- Kitchen: Electric cooktop; Electric oven; Microwave; Granite counters; Kitchen island; Pantry; Eat-in kitchen
- Bedrooms: Primary bedroom (Level 1) — approx. 14 x 12; Bedroom (Level 1) — approx. 11 x 11; Bedroom (Level 1) — approx. 11 x 11
- Flooring: Laminate
- Bathrooms: 2 full bathrooms; Primary bathroom with dual sinks and granite countertop
- Heating & cooling: Central heating (electric); Central air (electric); Ceiling fan(s)
- Interior features: Open floorplan; Eat-in kitchen; Kitchen island; Pantry; Granite counters; Decorative lighting; Double vanity; Built-in cabinets (in primary bath)
- Laundry & utility: Washer hookup; Electric water heater
Neighborhood map
What this means for you Summary
Snapshot
- This is a 3-bed/2.0-bath single-family listed at $243k. Condition is rated good.
Deal economics
- At list price, monthly cash flow is $219 ($3k/yr) — positive.
- The deal already cash-flows at list — no discount required.
- To meet the 1% rule (rent ≥ 1% of price), the offer needs to be $240k (1.1% below list).
- Recommended offer: $239k (1.5% below list) — sets the bar for market timing.
- Cap rate 7.4% vs local median 0.9% in Log Cabin — top-decile yield for the area; either an underpriced asset or a hidden risk that comps aren't pricing in. Stress-test before assuming the spread holds.
Location & tenants
- Location reads 38/100 on livability (#1,626 in TX) — a limited-amenity area; tenant pool skews transient or value-seeking. Strengths: cost of living A+, crime A; Watch: amenities F, commute F, employment F.
- Eustace ISD (rural): math 32% / reading 45% proficiency, ranked #455 of 826 in TX (top 55%) — families likely to look elsewhere, expect single-tenant / working-renter base with shorter leases; 62% free/reduced lunch — lower-income household profile, screen leases tightly.
- Zoned schools: Eustace Pri (497 students, 74% FRL); Eustace Middle (math 34% / reading 44%, grade F, #690 of 1,662 statewide, top 42%, 382 students, 63% FRL); Eustace H S (math 22% / reading 57%, grade F, #821 of 1,632 statewide, top 53%, 473 students, 56% FRL) — zoned schools at 64% FRL track the district average.
- Market conditions: 227 active listings in the ZIP; 1 comparable units currently listed for rent nearby; 263 units permitted in Henderson County in 2024 (0 in 5+ unit buildings).
Forward outlook
- Local home prices are declining (-3.0%/yr); year-one equity from $2k of loan paydown is wiped out by about $7k of value loss. Plan a longer hold.
Negotiation context
- It's been on market 24 days — a 2% lower offer ($239k) is reasonable based on typical stale-listing flexibility.
- 2 sale attempts with the ask held roughly flat each time — persistent listings suggest the price (not the market) is what's stuck; bring a comps-based counter.
Questions for the listing agent
- Is there a deadline driving the sale (1031 exchange, divorce, estate, relocation)? That informs how much negotiation room exists.
- Schools are F-rated, which usually means shorter tenancies and higher turnover. Who's the typical renter profile here, and what's been the actual vacancy rate?
- The area grade is low — what's the realistic commute time and amenity access for the typical tenant pool here? Any planned neighborhood developments (good or bad) we should know about?
- What's the average days-on-market for RENTAL listings here right now (not sales)? A rising rental-DOM trend means longer vacancies and softer asking-rent achievability than the comps imply.
- What's the recent tenant-quality profile in this submarket — average credit score on applications, eviction rate, late-payment / NSF rate, and stable-employment percentage? A property-management company in the area should have these aggregated.
- How much new for-sale + rental construction is in the pipeline within 1–3 miles? Heavy new supply typically softens prices + rents 12–24 months out; constrained supply supports both.
Investment metrics
- 1% rule
- 0.99% ✗
- Cap rate
- 7.38%
- Cash-on-cash
- 3.87%
- DSCR
- 1.17
- GRM
- 8.4
CMA / ARV
- ARV (median comp)
- $189,214
- List price
- $242,640
- Delta
- 28.24%
- Verdict
- OVERPRICED
- Comps
- 19 within 1.0 mi
Show comp detail 12 sales within ~0.75 mi
| Address | Dist | Beds/Ba | Sqft | Sold | Price | $/sf | Match |
|---|---|---|---|---|---|---|---|
| 14217 Alamo | 0.57mi | 3/2.0 | 1,350 (+0%) | 5mo | $250,000 | $185 | 69 |
| 187 Harris | 0.58mi | 3/2.0 | 1,300 (-4%) | 1mo | $210,000 | $162 | 66 |
| 221 Harris Blvd | 0.60mi | 3/2.0 | 1,361 (+1%) | 6mo | $235,000 | $173 | 65 |
| 14617 San Jacinto Dr | 0.27mi | 2/2.0 (-1) | 1,216 (-10%) | 2mo | $150,000 | $123 | 65 |
| 219 Harris Blvd | 0.59mi | 3/2.0 | 1,361 (+1%) | 8mo | $240,000 | $176 | 64 |
| 231 Harris Blvd | 0.62mi | 3/2.0 | 1,200 (-11%) | 1mo | $199,999 | $167 | 52 |
| 301 Harris Blvd | 0.70mi | 3/2.0 | 1,200 (-11%) | 2mo | $189,990 | $158 | 48 |
| 288 Harris Blvd | 0.65mi | 3/2.0 | 1,220 (-10%) | 9mo | $215,000 | $176 | 46 |
| 5018 Point Lavista | 0.75mi | 3/2.0 | 1,500 (+11%) | 1mo | $274,999 | $183 | 46 |
| 227 Harris Blvd | 0.59mi | 3/2.0 | 1,160 (-14%) | 6mo | $185,000 | $159 | 44 |
| 4898 Point La Vista Rd | 0.73mi | 3/2.0 | 1,520 (+13%) | 1mo | $279,000 | $184 | 44 |
| 157 Harris Blvd | 0.65mi | 2/2.5 (-1) | 1,224 (-9%) | 7mo | $200,000 | $163 | 42 |
Match score weights: distance 35% · size 25% · config 20% · recency 20%. Top-matched comps best support the ARV.
Projected returns pro-forma
-3.0% appreciation · 3.0% rent growth · sell at horizon
- IRR
- -10.2%
- Equity multiple
- 0.63×
- Total profit
- $-25,323
- Equity at exit
- $36,178
- IRR
- -0.8%
- Equity multiple
- 0.94×
- Total profit
- $-3,929
- Equity at exit
- $20,979
Cash invested: $67,939 (down + closing). Projections, not guarantees.
Landlord ↔ Tenant lean methodology
- Overall (STATE)
- 87 Strongly Landlord-Friendly
- State Texas
- 87 Strongly Landlord-Friendly · R+5
- County
- — inherits STATE
- City
- — inherits STATE
ZIP-level market 75148
- Home prices YoY
- -27.6%
- Active inventory
- 227
- Price-to-rent
- 8.4×
Monthly cashflow live
- Estimated rent
- $2,400 medium interval (Pro) →
- Mortgage (P&I)
- −$1,272
- Tax est. 1.5%
- −$303 /mo · $3,640/yr
- Insurance
- −$101
- HOA
- −$0
- Vacancy / Maint / Mgmt
- −$504
- Net cashflow
- $219
Break-even live
Sensitivity live
| Price | -10% $387 | -5% $303 | +0% $219 | +5% $135 | +10% $51 |
|---|---|---|---|---|---|
| Rent | -10% $30 | -5% $124 | +0% $219 | +5% $314 | +10% $409 |
| Rate | -1.0pp $341 | -0.5pp $281 | base $219 | +0.5pp $156 | +1.0pp $92 |
UW: 25.0% down · 7.5% · 30yr · 1.5% tax · 5.0% vac · 8.0% maint · 8.0% mgmt
Financing live
Cash to close
- Down payment
- $60,660
- Closing costs
- $7,279
- Reserves months
- —
- Total cash needed
- —
Loan-product check · same deal, 3 products live
Conventional
25% down · 7.5% · 30yr
- Down + closing
- —
- Monthly P&I
- —
- Monthly cashflow
- —
- DSCR
- —
- Eligible?
- —
Personal DTI + credit; lowest rate.
DSCR
20% down · 8.5% · 30yr
- Down + closing
- —
- Monthly P&I
- —
- Monthly cashflow
- —
- DSCR
- —
- Eligible?
- —
No personal income docs; deal must DSCR.
Hard money
10% down · 12.0% · 12mo
- Down + closing
- —
- Monthly P&I
- —
- Monthly cashflow
- —
- DSCR
- —
- Eligible?
- —
Short-term bridge; refi at stabilization.
Rent comps 1 comps
| Address | Beds | Baths | Sqft | Rent | $/sqft | DOM | Units | Dist |
|---|---|---|---|---|---|---|---|---|
| 5320 Loma Vis Malakoff, TX | 2.0 | 2.0 | 1324 | $2,400 | $1.81 | 45d | 1 | 0.85mi |
Listing history 18 events
-
2026-06-22days on market $242,640 Active 24 DOM
-
2026-06-19days on market $242,640 Active 21 DOM
-
2026-06-18days on market $242,640 Active 20 DOM
-
2026-06-17days on market $242,640 Active 19 DOM
-
2026-06-16days on market $242,640 Active 18 DOM
-
2026-06-15days on market $242,640 Active 17 DOM
-
2026-06-14days on market $242,640 Active 15 DOM
-
2026-06-12days on market $242,640 Active 14 DOM
-
2026-06-09days on market $242,640 Active 11 DOM
-
2026-06-08days on market $242,640 Active 10 DOM
-
2026-06-07days on market $242,640 Active 9 DOM
-
2026-06-05days on market $242,640 Active 6 DOM
-
2026-06-02days on market $242,640 Active 4 DOM
-
2026-06-01days on market $242,640 Active 3 DOM
-
2026-05-31days on market $242,640 Active 2 DOM
-
2026-05-14historical
-
2026-04-16price $242,640
-
2026-03-02$263,160 Active
ⓘ Source: listings_history table (triggers on properties + properties_extension) + one-shot
backfill from property_details.listing_events for pre-trigger history.
Nearby sold comps map
Loading sold comps map…
Walkable amenities ~0.75 mi
Loading nearby amenities…
Taxation est. · year 1
- Rental income
- $28,800
- − Mortgage interest
- −$13,592
- − Property taxes
- −$3,640
- − Insurance
- −$1,213
- − Repairs & maintenance
- −$2,304
- − Management
- −$2,304
- − Depreciation
- −$7,059
- Taxable loss
- −$1,311
- Est. tax savings @ 24.0%
- +$315
- After-tax cash flow
- $2,945/yr
For passive investors: Depreciation is non-cash, so a rental often shows a tax loss while cash-flowing — sheltering income. Rental losses are passive: they offset passive income freely, and up to $25,000/yr can offset ordinary (W-2) income if you actively participate and your MAGI is under $100k (phasing out to $0 by $150k); unused losses carry forward. On sale, claimed depreciation is recaptured at up to 25%, and gains may owe capital-gains tax (a 1031 exchange can defer both). Figures are a year-1 estimate at your 24.0% rate — not tax advice; consult a CPA.
Condition & rehab AI · 12 photos
This beautiful new build in Log Cabin, Texas is move-in ready with modern finishes and low-maintenance living.
Value-add opportunities
- Resale Paint interior walls — Fresh paint can make a home look more inviting and modern
- Both Install smart home devices — Enhances convenience and appeal for both buyers and renters
- Both Add outdoor lighting — Improves safety and curb appeal
Renovation cost estimate screening
Value-add ROI direction
- Resale Paint interior walls — Fresh paint can make a home look more inviting and modern ↑
- Both Install smart home devices — Enhances convenience and appeal for both buyers and renters ↑
- Both Add outdoor lighting — Improves safety and curb appeal ↑
ⓘ Cost ranges are severity-bucket heuristics (US national rule-of-thumb). Get contractor quotes + a written scope before underwriting a rehab budget.
Schools (NCES district)
- District
- Eustace ISD
- NCES district ID
- 4818720
- Math proficiency
- 32% ▼ -18.00%
- Reading proficiency
- 45% ▼ -7.00%
- Median HH income
- $42,425
- Composite
- 32.48/100
- National rank
- #5711
- State rank
- #455 of 826 in TX
Livability — Log Cabin
- Score
- 38/100
- State rank
- #1626
- US rank
- #27499
Category grades
Schools grade is shown separately in the Schools card above.
Census & demographics
- Census place
- Log Cabin, TX
- Population (ZIP)
- 5,944
Population outlook (Henderson County) Hauer SSP2
- Today (2025)
- 80,471 people
- By 2030
- 80,608 · +0.2%
- By 2040
- 80,087 · -0.5%
- By 2050
- 78,208 · -2.8%
- By 2075
- 72,423 · -10.0%
- By 2100
- 61,012 · -24.2%
Race, ethnicity, and origin ACS 2023
- Neighborhood character
- Predominantly White (71%)
- Race & ethnicity
- White 71% Two or more races 11% Hispanic / Latino 11% Black 11%
- Hispanic origin (detail)
- Mexican 10%
- Common ancestry
- Russian 2% Slovak 2% Italian 1%
- Foreign-born
- 5% · Canada
- Languages at home
- 92% English-only · Spanish 8%
Political lean MEDSL · Henderson
- 2024 margin
- Solid R (+63.5) · D 18.0% · R 81.4%
- 2008→2024 swing
- -18.8pp toward R · 2008: -44.6pp · 2024: -63.5pp
- All cycles
- 2024: R+63.5 2020: R+60.2 2016: R+60.0 2012: R+54.8 2008: R+44.6
Not yet ingested
- Civics
- —
Market trends
- HPI YoY
- ▼ -82.76%
- Current HPI
- 217.1629
- Rent YoY
- —
- Metro
- —
- State GDP YoY
- ▲ 3.95%
- F500 in state
- 110
Industry mix (Fortune 500 HQ in TX)
| Industry | F500 HQs | Revenue |
|---|---|---|
| Energy | 16 | $1,198B |
|
||
| Technology | 5 | $198B |
|
||
| Engineering / Construction | 4 | $72B |
|
||
| Energy Services | 3 | $60B |
|
||
| Utilities | 3 | $41B |
|
||
| Healthcare | 2 | $330B |
|
||
Price history
-7.8% since first listed4 events — show timeline
- 2026-05-28 Listed $242,640 NTREIS
- 2026-05-14 Listing Removed — NTREIS
- 2026-04-16 Price Changed $242,640 NTREIS
- 2026-03-02 Listed $263,160 NTREIS
Cash-flow waterfall
monthlySold comps — $/sqft
last 12 mo · ≤1 miLoading sold comps…