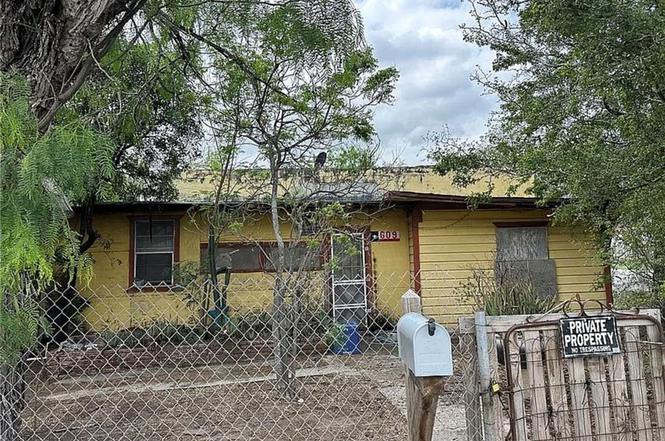
609 N Holland Ave
Mission, TX 78572
$50,000B-
2 bd · 1.0 ba ·
1,165 sqft ·
Built 1961
· SingleFamily
· Pending
· 9 DOM
Cashflow @ list (25.0% down · 7.5%)
Estimated rent
$1,202/mo
Mortgage (P&I)
−$262
Tax + insurance
−$135
HOA
−$0
Vac / Maint / Mgmt
−$253
Net cashflow
$552/mo
Annual
$6,628/yr
Cap rate
19.55%
Cash-on-cash
47.34%
DSCR
3.11
1% rule
2.40%
Cash to close
$14,000
Investor read
- This is a 2-bed/1.0-bath single-family listed at $50k.
- At list price, monthly cash flow is $552 ($7k/yr) — positive.
- The deal already cash-flows at list — no discount required.
- Meets the 1% rule at list price ($1k rent vs $50k).
- Only 9 days on market — expect competitive offers; lowballing is unlikely to land.
- Local home prices are declining (-3.0%/yr); year-one equity from $346 of loan paydown is wiped out by about $2k of value loss. Plan a longer hold.
- Location reads 75/100 on livability (#148 in TX, #4,155 nationally) — a middle-class / working-renter tenant base. Strengths: cost of living A+, housing A+, health & safety A+; Watch: amenities F, commute F, employment D-.
- Mission CISD (urban): math 15% / reading 28% proficiency, ranked #775 of 826 in TX (top 94%) — low school quality limits family demand, transient renter base, plan for 1-2y turnover; 78% free/reduced lunch — lower-income household profile, screen leases tightly.
- Zoned schools: Pearson El (math 8% / reading 17%, grade F, #4,180 of 4,322 statewide, top 97%, 373 students, 94% FRL); Mission J H (math 13% / reading 26%, grade F, #1,445 of 1,662 statewide, top 88%, 680 students, 78% FRL); Mission H S (math 18% / reading 28%, grade F, #1,348 of 1,632 statewide, top 83%, 2,218 students, 91% FRL).
- Watch-outs: property tax is 2.8% of price.
- Market conditions: Rents flat; 852 active listings in the ZIP; 27 comparable units currently listed for rent nearby; rentals lingering (median 46d on market — plan ~5-8 weeks vacancy on turnover, expect pricing pressure); 52% of comp listings sitting > 30 days — soft ceiling on asking rent; 7,378 units permitted in Hidalgo County in 2024 (641 in 5+ unit buildings).
- Hidalgo County population projected at +28% by 2050 — long-run rental-demand tailwind backs the buy-and-hold thesis.
- At projected returns (-3.0% appreciation + 0.9% rent growth), your $14k cash investment doubles in ~3 years — after that, you're playing with house money.
- Climate carrying-cost: severe wind risk, 94% chance of damaging wind over 30y; extreme-heat days projected 7→22/yr by 2055 (HVAC capex compounding) — expect insurance premiums to compound above CPI over the hold.
- Cap rate 19.5% vs local median 3.5% in Mission — top-decile yield for the area; either an underpriced asset or a hidden risk that comps aren't pricing in. Stress-test before assuming the spread holds.
Questions for listing agent
- Built in 1961 — when were the roof, HVAC, electrical panel, plumbing, and water heater last replaced?
- Property tax is high relative to price — has the assessment been appealed recently, and will the sale trigger a re-assessment?
- Is there a deadline driving the sale (1031 exchange, divorce, estate, relocation)? That informs how much negotiation room exists.
- What's the average days-on-market for RENTAL listings here right now (not sales)? A rising rental-DOM trend means longer vacancies and softer asking-rent achievability than the comps imply.
- What's the recent tenant-quality profile in this submarket — average credit score on applications, eviction rate, late-payment / NSF rate, and stable-employment percentage? A property-management company in the area should have these aggregated.
- How much new for-sale + rental construction is in the pipeline within 1–3 miles? Heavy new supply typically softens prices + rents 12–24 months out; constrained supply supports both.
CashFlowRE · CFR-8KBR2NDRNY1YC5
· Data 4 weeks ago
cashflowre.app · 2026-05-29