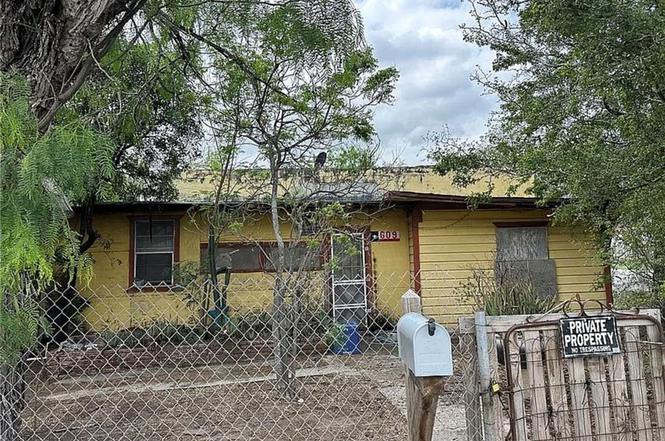
609 N Holland Ave · Mission, TX
Flood risk 1/10 · Minimal
- FEMA flood zone
- X
- Chance of flooding over 30 yrs
- 0.0%
- Est. flood insurance / yr
- $507 – $1,088
Fire risk 4/10 · Minor
- Est. fire insurance / yr
- $1,222 – $2,270
Heat risk 9/10 · Severe
- Hot days now (above 111°F)
- 7 days/yr
- Hot days in 30 yrs
- 22 days/yr
Wind risk 8/10 · Major
- Chance of severe wind over 30 yrs
- 94.0%
Air-quality risk 2/10 · Minimal
- Unhealthy air days now
- 1 days/yr
- Unhealthy air days in 30 yrs
- 2 days/yr
Risk factors via First Street. Map © Google.
Why this score? — see what drove the B- grade
The composite is a weighted blend of 9 inputs, each scored 0–100. Each bar is that input's sub-score; the figure is the points it added to the 100-point composite (weight × sub-score).
- Cash flow +30.0/30.0
- 1% rule +10.0/10.0
- DSCR +10.0/10.0
- ARV discount +7.5/15.0
- Livability +3.8/5.0
- Rent growth +2.7/5.0
- Condition / age +2.5/5.0
- Schools +1.7/10.0
- Appreciation +0.0/10.0
$50,000
🖨 Deal sheet (PDF) 📄 Offer letter ✓ Due diligence
Listing remarks
This home sits on 2 city lots, Bonita Lot 1 & Lot 2. Property is being sold for land lots only. Home is in deteriorating conditions. Property being sold as is.
Key facts
- 4,365 sq ft lot
- Built 1961
- Listed 9 days
Neighborhood map
What this means for you Summary
Snapshot
- This is a 2-bed/1.0-bath single-family listed at $50k.
Deal economics
- At list price, monthly cash flow is $552 ($7k/yr) — positive.
- The deal already cash-flows at list — no discount required.
- Meets the 1% rule at list price ($1k rent vs $50k).
- Cap rate 19.5% vs local median 3.5% in Mission — top-decile yield for the area; either an underpriced asset or a hidden risk that comps aren't pricing in. Stress-test before assuming the spread holds.
Location & tenants
- Location reads 75/100 on livability (#148 in TX, #4,155 nationally) — a middle-class / working-renter tenant base. Strengths: cost of living A+, housing A+, health & safety A+; Watch: amenities F, commute F, employment D-.
- Mission CISD (urban): math 15% / reading 28% proficiency, ranked #775 of 826 in TX (top 94%) — low school quality limits family demand, transient renter base, plan for 1-2y turnover; 78% free/reduced lunch — lower-income household profile, screen leases tightly.
- Zoned schools: Pearson El (math 8% / reading 17%, grade F, #4,180 of 4,322 statewide, top 97%, 373 students, 94% FRL); Mission J H (math 13% / reading 26%, grade F, #1,445 of 1,662 statewide, top 88%, 680 students, 78% FRL); Mission H S (math 18% / reading 28%, grade F, #1,348 of 1,632 statewide, top 83%, 2,218 students, 91% FRL).
- Market conditions: Rents flat; 852 active listings in the ZIP; 27 comparable units currently listed for rent nearby; rentals lingering (median 45d on market — plan ~5-8 weeks vacancy on turnover, expect pricing pressure); 52% of comp listings sitting > 30 days — soft ceiling on asking rent; 7,378 units permitted in Hidalgo County in 2024 (641 in 5+ unit buildings).
Forward outlook
- Local home prices are declining (-3.0%/yr); year-one equity from $346 of loan paydown is wiped out by about $2k of value loss. Plan a longer hold.
- Hidalgo County population projected at +28% by 2050 — long-run rental-demand tailwind backs the buy-and-hold thesis.
- At projected returns (-3.0% appreciation + 0.9% rent growth), your $14k cash investment doubles in ~3 years — after that, you're playing with house money.
Negotiation context
- Only 9 days on market — expect competitive offers; lowballing is unlikely to land.
Risks & watch-outs
- Watch-outs: property tax is 2.8% of price.
- Climate carrying-cost: severe wind risk, 94% chance of damaging wind over 30y; extreme-heat days projected 7→22/yr by 2055 (HVAC capex compounding) — expect insurance premiums to compound above CPI over the hold.
Questions for the listing agent
- Built in 1961 — when were the roof, HVAC, electrical panel, plumbing, and water heater last replaced?
- Property tax is high relative to price — has the assessment been appealed recently, and will the sale trigger a re-assessment?
- Is there a deadline driving the sale (1031 exchange, divorce, estate, relocation)? That informs how much negotiation room exists.
- What's the average days-on-market for RENTAL listings here right now (not sales)? A rising rental-DOM trend means longer vacancies and softer asking-rent achievability than the comps imply.
- What's the recent tenant-quality profile in this submarket — average credit score on applications, eviction rate, late-payment / NSF rate, and stable-employment percentage? A property-management company in the area should have these aggregated.
- How much new for-sale + rental construction is in the pipeline within 1–3 miles? Heavy new supply typically softens prices + rents 12–24 months out; constrained supply supports both.
Investment metrics
- 1% rule
- 2.40% ✓
- Cap rate
- 19.55%
- Cash-on-cash
- 47.34%
- DSCR
- 3.11
- GRM
- 3.5
CMA / ARV
- ARV (on-the-fly)
- $170,090
- Comps found
- 3
Show comp detail 3 sales within ~0.75 mi
| Address | Dist | Beds/Ba | Sqft | Sold | Price | $/sf | Match |
|---|---|---|---|---|---|---|---|
| 721 W 4th St | 0.15mi | 3/1.5 (+1) | 1,194 (+2%) | 4mo | $138,000 | $116 | 79 |
| 305 S Holland Ave | 0.57mi | 3/2.0 (+1) | 1,270 (+9%) | 8mo | $202,000 | $159 | 43 |
| 1005 E Blake St | 0.65mi | 3/2.0 (+1) | 1,337 (+15%) | 7mo | $195,000 | $146 | 30 |
Match score weights: distance 35% · size 25% · config 20% · recency 20%. Top-matched comps best support the ARV.
Projected returns pro-forma
-3.0% appreciation · 0.93% rent growth · sell at horizon
- IRR
- 42.3%
- Equity multiple
- 2.76×
- Total profit
- $24,670
- Equity at exit
- $7,455
- IRR
- 47.4%
- Equity multiple
- 5.09×
- Total profit
- $57,321
- Equity at exit
- $4,323
Cash invested: $14,000 (down + closing). Projections, not guarantees.
Landlord ↔ Tenant lean methodology
- Overall (STATE)
- 87 Strongly Landlord-Friendly
- State Texas
- 87 Strongly Landlord-Friendly · R+5
- County
- — inherits STATE
- City
- — inherits STATE
ZIP-level market 78572
- Home prices YoY
- -22.9%
- Rents YoY
- 0.9%
- Active inventory
- 852
- Price-to-rent
- 3.5×
Monthly cashflow live
- Estimated rent
- $1,202 high interval (Pro) →
- Mortgage (P&I)
- −$262
- Tax from tax record
- −$115 /mo · $1,376/yr
- Insurance
- −$21
- HOA
- −$0
- Vacancy / Maint / Mgmt
- −$253
- Net cashflow
- $552
Break-even live
Sensitivity live
| Price | -10% $581 | -5% $566 | +0% $552 | +5% $538 | +10% $524 |
|---|---|---|---|---|---|
| Rent | -10% $457 | -5% $505 | +0% $552 | +5% $600 | +10% $647 |
| Rate | -1.0pp $577 | -0.5pp $565 | base $552 | +0.5pp $539 | +1.0pp $526 |
UW: 25.0% down · 7.5% · 30yr · 1.5% tax · 5.0% vac · 8.0% maint · 8.0% mgmt
Financing live
Cash to close
- Down payment
- $12,500
- Closing costs
- $1,500
- Reserves months
- —
- Total cash needed
- —
Loan-product check · same deal, 3 products live
Conventional
25% down · 7.5% · 30yr
- Down + closing
- —
- Monthly P&I
- —
- Monthly cashflow
- —
- DSCR
- —
- Eligible?
- —
Personal DTI + credit; lowest rate.
DSCR
20% down · 8.5% · 30yr
- Down + closing
- —
- Monthly P&I
- —
- Monthly cashflow
- —
- DSCR
- —
- Eligible?
- —
No personal income docs; deal must DSCR.
Hard money
10% down · 12.0% · 12mo
- Down + closing
- —
- Monthly P&I
- —
- Monthly cashflow
- —
- DSCR
- —
- Eligible?
- —
Short-term bridge; refi at stabilization.
Rent comps 27 comps
| Address | Beds | Baths | Sqft | Rent | $/sqft | DOM | Units | Dist |
|---|---|---|---|---|---|---|---|---|
| 906 Hidden Hills St Unit 4 Mission, TX | 2.0 | 3.0 | 1180 | $1,250 | $1.06 | 15d | 1 | 0.09mi |
| 721 W 4th St Mission, TX | 3.0 | 1.5 | 1194 | $1,400 | $1.17 | 15d | 1 | 0.18mi |
| 523 Perkins Ave Mission, TX | 2.0 | 2.0 | 1050 | $950 | $0.90 | 45d | 1 | 0.38mi |
| 7102 N 56th Ln Unit 1 Mission, TX | 2.0 | 2.0 | 980 | $1,075 | $1.10 | 22d | 1 | 0.42mi |
| 1500 Industrial Way Unit A Mission, TX | 2.0 | 1.0 | 990 | $990 | $1.00 | 45d | 1 | 0.65mi |
| 221 W 14th St Mission, TX | 3.0 | 2.0 | 1290 | $1,100 | $0.85 | 45d | 1 | 0.71mi |
| 983 Washington Ave Mission, TX | 3.0 | 2.0 | 1040 | $1,300 | $1.25 | 45d | 1 | 0.74mi |
| 1400 N Dunlap Ave Mission, TX | 2.0 | 1.0 | 1068 | $800 | $0.75 | 20d | 1 | 0.76mi |
| 401 Bertha Ave Unit 3 Mission, TX | 2.0 | 2.0 | 1050 | $1,200 | $1.14 | 20d | 1 | 0.83mi |
| 401 Bertha Ave Unit 2 Mission, TX | 2.0 | 2.0 | 950 | $1,300 | $1.37 | 45d | 1 | 0.83mi |
| 1513 W B St Mission, TX | 3.0 | 2.0 | 868 | $1,300 | $1.50 | 15d | 1 | 0.94mi |
| 1513 W B St Mission, TX | 3.0 | 2.0 | 868 | $1,300 | $1.50 | 45d | 1 | 0.94mi |
| 1525 W B St Mission, TX | 2.0 | 2.0 | 852 | $1,350 | $1.58 | 20d | 1 | 0.96mi |
| 1811 Perkins Ave Unit 7 Mission, TX | 2.0 | 1.0 | 850 | $750 | $0.88 | 15d | 1 | 0.97mi |
| 1605 W B St Mission, TX | 2.0 | 2.0 | 814 | $1,200 | $1.47 | 45d | 1 | 0.98mi |
| 2002 Thornton St Mission, TX | 3.0 | 2.0 | 1374 | $1,300 | $0.95 | 45d | 1 | 1.02mi |
| 2008 N Cummings Ave Mission, TX | 3.0 | 2.0 | 1012 | $1,300 | $1.28 | 45d | 1 | 1.08mi |
| 1600 Inspiration Rd Apt 34 Mission, TX | 2.0 | 1.0 | 868 | $780 | $0.90 | 45d | 1 | 1.19mi |
| 1604 Inspiration Rd Unit 14 Mission, TX | 2.0 | 2.0 | 740 | $775 | $1.05 | 20d | 1 | 1.19mi |
| 1604 Inspiration Rd Unit 16 Mission, TX | 2.0 | 2.0 | 740 | $775 | $1.05 | 45d | 1 | 1.19mi |
| 304 S Tecate Dr Mission, TX | 3.0 | 2.0 | 1378 | $1,700 | $1.23 | 45d | 1 | 1.33mi |
| 702 W 25th St Mission, TX | 3.0 | 2.0 | 1375 | $1,650 | $1.20 | 20d | 1 | 1.39mi |
| 1525 Oasis Dr Unit 4 Mission, TX | 3.0 | 2.0 | 1100 | $825 | $0.75 | 15d | 1 | 1.39mi |
| 402 Cory Dr Unit B-10 Mission, TX | 2.0 | 1.0 | 714 | $750 | $1.05 | 45d | 1 | 1.42mi |
| 405 Cory Dr Mission, TX | 2.0 | 1.0 | 832 | $750 | $0.90 | 22d | 1 | 1.45mi |
| 1707 Highland Park Ave Unit 4-B Mission, TX | 2.0 | 2.0 | 1336 | $1,200 | $0.90 | 15d | 1 | 1.46mi |
| 1802 Oasis Dr Unit 202 Mission, TX | 2.0 | 1.0 | 893 | $850 | $0.95 | 45d | 1 | 1.49mi |
Listing history 2 events
-
2025-07-02status Pending
-
2025-06-23$50,000 Active
ⓘ Source: listings_history table (triggers on properties + properties_extension) + one-shot
backfill from property_details.listing_events for pre-trigger history.
Tax reassessment forecast TX · Resets to sale price
- Current annual tax
- $1,376 · $115/mo
- Projected year-2 tax
- $1,376 · $115/mo
- Expected delta
- $0/yr ($0/mo · 0.0%)
ⓘ Screening estimate from a state-policy table — verify with the county assessor before closing.
Climate risk First Street
- Flood 1/10 Low FEMA zone X · 0% chance over 30 yrs
- Wildfire 4/10 Moderate
- Heat 9/10 Extreme 7 d/yr ≥111°F today · 22 d/yr by 30 yrs out
- Wind 8/10 Severe 94% chance of damaging wind over 30 yrs
- Air quality 2/10 Low 1 unhealthy d/yr today · 2 by 30 yrs out
Nearby sold comps map
Loading sold comps map…
Walkable amenities ~0.75 mi
Loading nearby amenities…
Taxation est. · year 1
- Rental income
- $14,430
- − Mortgage interest
- −$2,801
- − Property taxes
- −$1,376
- − Insurance
- −$250
- − Repairs & maintenance
- −$1,154
- − Management
- −$1,154
- − Depreciation
- −$1,455
- Taxable income
- $6,240
- Est. tax owed @ 24.0%
- −$1,498
- After-tax cash flow
- $5,130/yr
For passive investors: Depreciation is non-cash, so a rental often shows a tax loss while cash-flowing — sheltering income. Rental losses are passive: they offset passive income freely, and up to $25,000/yr can offset ordinary (W-2) income if you actively participate and your MAGI is under $100k (phasing out to $0 by $150k); unused losses carry forward. On sale, claimed depreciation is recaptured at up to 25%, and gains may owe capital-gains tax (a 1031 exchange can defer both). Figures are a year-1 estimate at your 24.0% rate — not tax advice; consult a CPA.
Schools (NCES district)
- District
- Mission CISD
- NCES district ID
- 4831040
- Math proficiency
- 15% ▼ -35.00%
- Reading proficiency
- 28% ▼ -15.00%
- Median HH income
- $32,855
- Composite
- 17.47/100
- National rank
- #9061
- State rank
- #775 of 826 in TX
Livability — Mission
- Score
- 75/100
- State rank
- #148
- US rank
- #4155
Category grades
Schools grade is shown separately in the Schools card above.
Census & demographics
- Census place
- Mission, TX
- County
- Hidalgo County · 623,128 people
- City population
- 78,024
- Metro
- McAllen-Edinburg-Mission, TX
- Population (ZIP)
- 78,024
- Household income
- $54,298
- Rent vs Own
- Severe rent burden
- 1714.0
Population outlook (Hidalgo County) Hauer SSP2
- Today (2025)
- 955,232 people
- By 2030
- 1,009,774 · +5.7%
- By 2040
- 1,120,332 · +17.3%
- By 2050
- 1,225,036 · +28.2%
- By 2075
- 1,439,189 · +50.7%
- By 2100
- 1,533,429 · +60.5%
Race, ethnicity, and origin ACS 2023
- Neighborhood character
- Predominantly Hispanic (85%)
- Race & ethnicity
- Hispanic / Latino 85% Two or more races 47% White 12% Asian 2%
- Hispanic origin (detail)
- Mexican 80%
- Common ancestry
- Slovak 1% Portuguese 0%
- Foreign-born
- 28% · Canada, South Korea
- Languages at home
- 22% English-only · Spanish 76%
Political lean MEDSL · Hidalgo
- 2024 margin
- Toss-up / Even · D 48.1% · R 51.0%
- 2008→2024 swing
- -41.6pp toward R · 2008: 38.7pp · 2024: -2.9pp
- All cycles
- 2024: R+2.9 2020: D+17.1 2016: D+40.5 2012: D+41.8 2008: D+38.7
Not yet ingested
- Civics
- —
Market trends
- HPI YoY
- ▼ -62.35%
- Current HPI
- 209.3573
- Rent YoY
- ▲ 0.93%
- Metro
- McAllen-Edinburg-Mission, TX
- State GDP YoY
- ▲ 3.95%
- F500 in state
- 110
Industry mix (Fortune 500 HQ in TX)
| Industry | F500 HQs | Revenue |
|---|---|---|
| Energy | 16 | $1,198B |
|
||
| Technology | 5 | $198B |
|
||
| Engineering / Construction | 4 | $72B |
|
||
| Energy Services | 3 | $60B |
|
||
| Utilities | 3 | $41B |
|
||
| Healthcare | 2 | $330B |
|
||
Price history
2 events — show timeline
- 2025-07-02 Pending — MCALLENMLS
- 2025-06-23 Listed $50,000 MCALLENMLS
Property tax history
+5.6%/yrLatest (2025): $1,376 · +20.0% YoY. Source: county tax records.
Cash-flow waterfall
monthlySold comps — $/sqft
last 12 mo · ≤1 miLoading sold comps…