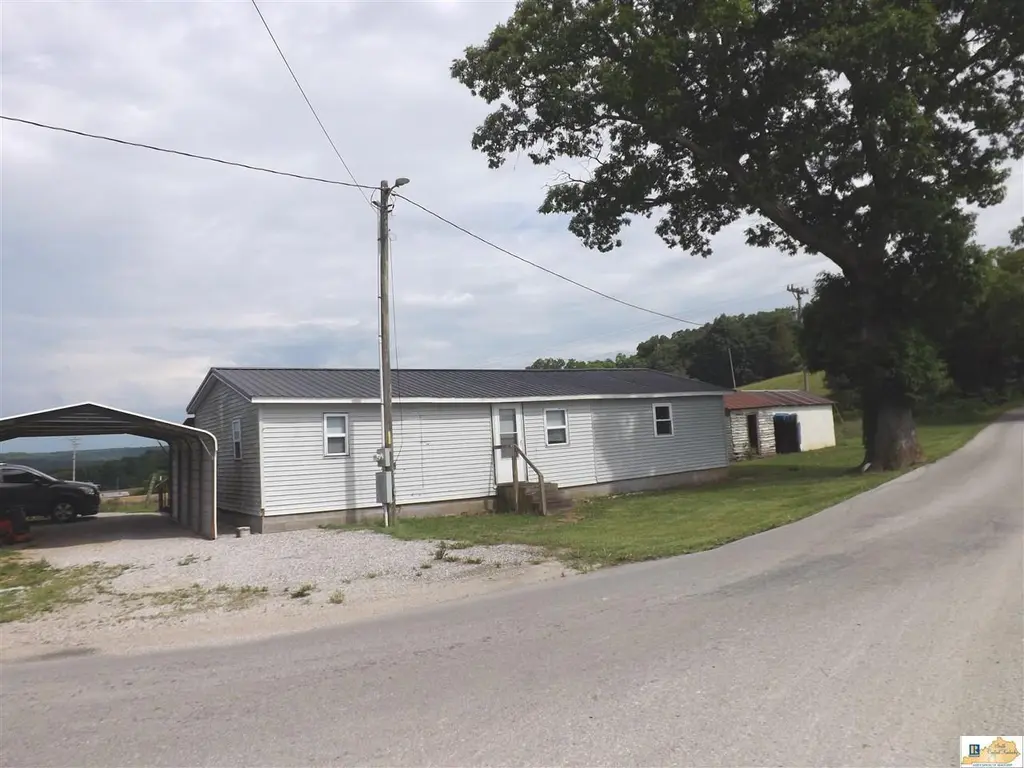
2825 Flint Ridge Rd
Horse Cave, KY 42749
$125,000C-
3 bd · 1.0 ba ·
936 sqft ·
Built 1973
· Other
· Active
· 10 DOM
Cashflow @ list (25.0% down · 7.5%)
Estimated rent
$1,033/mo
Mortgage (P&I)
−$656
Tax + insurance
−$94
HOA
−$0
Vac / Maint / Mgmt
−$217
Net cashflow
$67/mo
Annual
$799/yr
Cap rate
6.93%
Cash-on-cash
2.28%
DSCR
1.10
1% rule
0.83%
Cash to close
$35,000
Investor read
- This is a 3-bed/1.0-bath other listed at $125k.
- At list price, monthly cash flow is $67 ($799/yr) — positive.
- The deal already cash-flows at list — no discount required.
- To meet the 1% rule (rent ≥ 1% of price), the offer needs to be $103k (17.3% below list).
- Only 10 days on market — expect competitive offers; lowballing is unlikely to land.
- Recommended offer: $103k (17.3% below list) — sets the bar for 1% rule.
- In year one you build about $13k of equity ($864 loan paydown + $12k appreciation (10.0% local appreciation)).
- Location reads 67/100 on livability (#206 in KY) — a middle-class / working-renter tenant base. Strengths: crime A+, cost of living A+, housing A+; Watch: amenities F, commute F, employment D-.
- Hart County (rural): math 21% / reading 38% proficiency, ranked #119 of 165 in KY (top 72%) — low school quality limits family demand, transient renter base, plan for 1-2y turnover.
- Zoned schools: Legrande Elementary School (math 12% / reading 32%, grade F, #525 of 676 statewide, top 82%, 294 students, 52% FRL); Hart County High School (math 22% / reading 32%, grade F, #158 of 254 statewide, top 68%, 679 students, 55% FRL) — zoned schools at 54% FRL track the district average.
- Market conditions: 55 active listings in the ZIP; 79 units permitted in Hart County in 2024 (60 in 5+ unit buildings).
- At projected returns (10.0% appreciation + 3.0% rent growth), your $35k cash investment doubles in ~3 years — after that, you're playing with house money.
- By year 3, paydown + projected appreciation supports a ~$34k cash-out refi (75% LTV) — recoverable capital for the next deal without selling this one.
- Climate carrying-cost: moderate wildfire risk; extreme-heat days projected 7→19/yr by 2055 (HVAC capex compounding) — expect insurance premiums to compound above CPI over the hold.
- Cap rate 6.9% vs local median 3.7% in Horse Cave — top-decile yield for the area; either an underpriced asset or a hidden risk that comps aren't pricing in. Stress-test before assuming the spread holds.
Questions for listing agent
- Built in 1973 — when were the roof, HVAC, electrical panel, plumbing, and water heater last replaced?
- Is there a deadline driving the sale (1031 exchange, divorce, estate, relocation)? That informs how much negotiation room exists.
- Schools are F-rated, which usually means shorter tenancies and higher turnover. Who's the typical renter profile here, and what's been the actual vacancy rate?
- What's the average days-on-market for RENTAL listings here right now (not sales)? A rising rental-DOM trend means longer vacancies and softer asking-rent achievability than the comps imply.
- What's the recent tenant-quality profile in this submarket — average credit score on applications, eviction rate, late-payment / NSF rate, and stable-employment percentage? A property-management company in the area should have these aggregated.
- How much new for-sale + rental construction is in the pipeline within 1–3 miles? Heavy new supply typically softens prices + rents 12–24 months out; constrained supply supports both.
CashFlowRE · CFR-8KC4JKA4XPBSAX
· Data 2 days ago
cashflowre.app · 2026-05-29