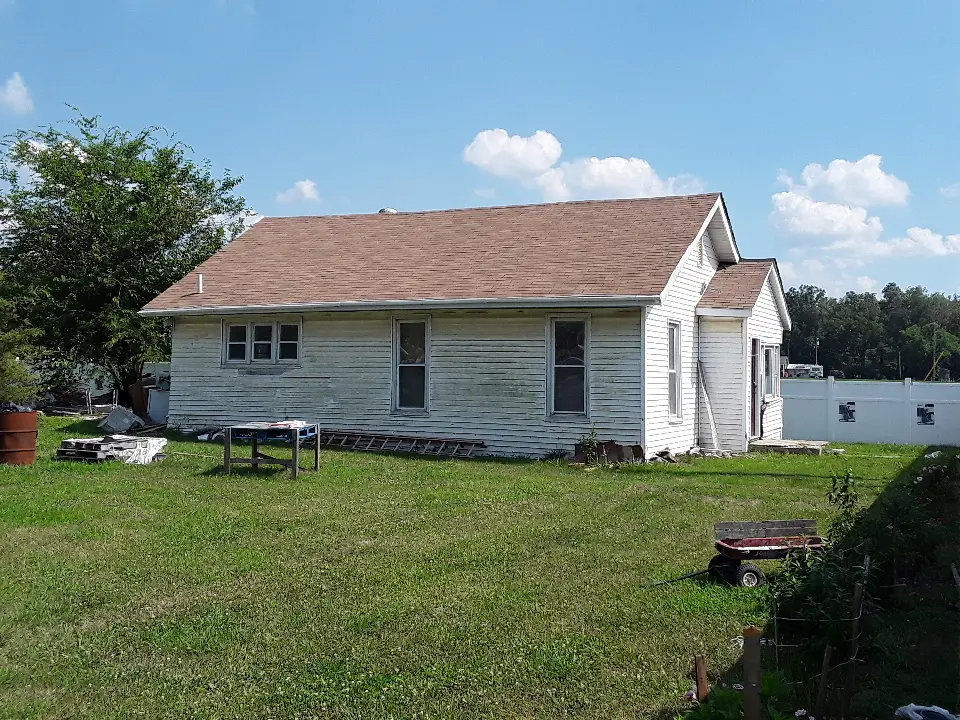
16870 Illinois 149 Hwy
Bush, IL 62924
$13,800D
2 bd · 1.0 ba ·
1,139 sqft ·
Built 1900
· Other
· Pending
· 18 DOM
Cashflow @ list (25.0% down · 7.5%)
Estimated rent
$1,000/mo
Mortgage (P&I)
−$72
Tax + insurance
−$23
HOA
−$0
Vac / Maint / Mgmt
−$210
Net cashflow
$695/mo
Annual
$8,339/yr
Cap rate
66.72%
Cash-on-cash
215.81%
DSCR
10.60
1% rule
7.25%
Cash to close
$3,864
Investor read
- This is a 2-bed/1.0-bath other listed at $14k.
- At list price, monthly cash flow is $695 ($8k/yr) — positive.
- The deal already cash-flows at list — no discount required.
- Meets the 1% rule at list price ($1k rent vs $14k).
- It's been on market 18 days — a 2% lower offer ($14k) is reasonable based on typical stale-listing flexibility.
- Recommended offer: $14k (1.5% below list) — sets the bar for market timing.
- Local home prices are declining (-3.0%/yr); year-one equity from $95 of loan paydown is wiped out by about $414 of value loss. Plan a longer hold.
- Location reads 60/100 on livability (#994 in IL) — a middle-class / working-renter tenant base. Strengths: cost of living A+, housing A+; Watch: crime F, amenities F, commute F.
- Herrin CUSD 4 (suburban): math 22% / reading 27% proficiency, ranked #364 of 620 in IL (top 59%) — low school quality limits family demand, transient renter base, plan for 1-2y turnover.
- Zoned schools: Herrin C U S D 4 Elem School (math 21% / reading 25%, grade F, #929 of 2,056 statewide, top 45%, 679 students, 0% FRL); Herrin Middle School (math 24% / reading 28%, grade F, #318 of 665 statewide, top 48%, 507 students, 0% FRL); Herrin High School (math 22% / reading 32%, grade F, #218 of 693 statewide, top 35%, 686 students, 0% FRL) — zoned schools average 0% FRL vs 56% district-wide (56 pts lower); this property's tenant base skews higher-income than the district average.
- Watch-outs: built in 1900 — expect roof / HVAC / electrical / plumbing capex.
- Market conditions: 18 active listings in the ZIP; 130 units permitted in Williamson County in 2024 (5 in 5+ unit buildings).
- Current owner paid $11k; 25% above their basis — modest negotiation headroom, anchor on the comps not their cost.
- At projected returns (-3.0% appreciation + 3.0% rent growth), your $4k cash investment doubles in ~1 year — after that, you're playing with house money.
- Climate carrying-cost: extreme-heat days projected 7→20/yr by 2055 (HVAC capex compounding) — expect insurance premiums to compound above CPI over the hold.
Questions for listing agent
- Built in 1900 — when were the roof, HVAC, electrical panel, plumbing, and water heater last replaced?
- Is there a deadline driving the sale (1031 exchange, divorce, estate, relocation)? That informs how much negotiation room exists.
- Schools are F-rated, which usually means shorter tenancies and higher turnover. Who's the typical renter profile here, and what's been the actual vacancy rate?
- Crime grade is F in this area — have there been break-ins, vandalism, or insurance claims at this property in the last 3 years? What carrier currently insures it and at what premium?
- The area grade is low — what's the realistic commute time and amenity access for the typical tenant pool here? Any planned neighborhood developments (good or bad) we should know about?
- What's the average days-on-market for RENTAL listings here right now (not sales)? A rising rental-DOM trend means longer vacancies and softer asking-rent achievability than the comps imply.
- What's the recent tenant-quality profile in this submarket — average credit score on applications, eviction rate, late-payment / NSF rate, and stable-employment percentage? A property-management company in the area should have these aggregated.
- How much new for-sale + rental construction is in the pipeline within 1–3 miles? Heavy new supply typically softens prices + rents 12–24 months out; constrained supply supports both.
CashFlowRE · CFR-8KPXXJ01J1J7RJ
· Data 2 weeks ago
cashflowre.app · 2026-05-29