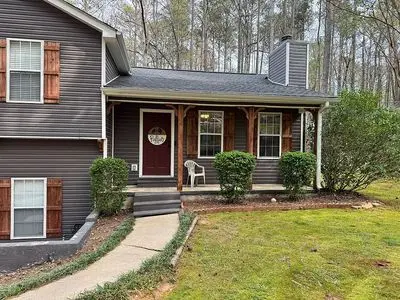
48 E Mourning Dove Ct
Monticello, GA 31064
$290,000D-
3 bd · 2.0 ba ·
1,523 sqft ·
Built 2003
· SingleFamily
· Under Contract
Cashflow @ list (25.0% down · 7.5%)
Estimated rent
$1,982/mo
Mortgage (P&I)
−$1,521
Tax + insurance
−$360
HOA
−$0
Vac / Maint / Mgmt
−$416
Net cashflow
$-315/mo
Annual
$-3,785/yr
Cap rate
4.99%
Cash-on-cash
-4.66%
DSCR
0.79
1% rule
0.68%
Cash to close
$81,200
Investor read
- This is a 3-bed/2.0-bath single-family listed at $290k.
- At list price, monthly cash flow is $-315 ($-4k/yr) — negative.
- To cash-flow at today's rent, offer at most $234k (19.2% below list).
- To meet the 1% rule (rent ≥ 1% of price), the offer needs to be $198k (31.7% below list).
- Only 0 days on market — expect competitive offers; lowballing is unlikely to land.
- Recommended offer: $198k (31.7% below list) — sets the bar for 1% rule.
- In year one you build about $31k of equity ($2k loan paydown + $29k appreciation (10.0% local appreciation)).
- Location reads 79/100 on livability (#16 in GA, #2,229 nationally) — a middle-class / working-renter tenant base. Strengths: crime A+, cost of living A+, housing A+; Watch: amenities C-, employment D+, schools F.
- Jasper County (rural): math 24% / reading 30% proficiency, ranked #113 of 174 in GA (top 65%) — low school quality limits family demand, transient renter base, plan for 1-2y turnover; 60% free/reduced lunch — lower-income household profile, screen leases tightly.
- Market conditions: 174 active listings in the ZIP; 183 units permitted in Jasper County in 2024 (0 in 5+ unit buildings).
- Jasper County population projected at -24% by 2050 — secular population decline; favor cash flow + early exit over multi-decade hold.
- Current owner paid $80k; list at $290k implies a 262% gain — meaningful room to come down on a strong offer.
- By year 2, paydown + projected appreciation supports a ~$50k cash-out refi (75% LTV) — recoverable capital for the next deal without selling this one.
- Climate carrying-cost: major wind risk, 27% chance of damaging wind over 30y; extreme-heat days projected 7→17/yr by 2055 (HVAC capex compounding) — expect insurance premiums to compound above CPI over the hold.
- Cap rate 5.0% vs local median 3.9% in Monticello — meaningfully above typical; check what's discounted (condition, days-on-market, listing class) to confirm the premium yield is real.
Questions for listing agent
- What do current leases actually rent for vs. the listed asking? Can we see a recent rent roll and the last 12 months of T-12 income?
- Is there a deadline driving the sale (1031 exchange, divorce, estate, relocation)? That informs how much negotiation room exists.
- Schools are F-rated, which usually means shorter tenancies and higher turnover. Who's the typical renter profile here, and what's been the actual vacancy rate?
- The area grade is low — what's the realistic commute time and amenity access for the typical tenant pool here? Any planned neighborhood developments (good or bad) we should know about?
- What's the average days-on-market for RENTAL listings here right now (not sales)? A rising rental-DOM trend means longer vacancies and softer asking-rent achievability than the comps imply.
- What's the recent tenant-quality profile in this submarket — average credit score on applications, eviction rate, late-payment / NSF rate, and stable-employment percentage? A property-management company in the area should have these aggregated.
- How much new for-sale + rental construction is in the pipeline within 1–3 miles? Heavy new supply typically softens prices + rents 12–24 months out; constrained supply supports both.
CashFlowRE · CFR-8KT1SJFADE1SQK
· Data 1 week ago
cashflowre.app · 2026-05-29