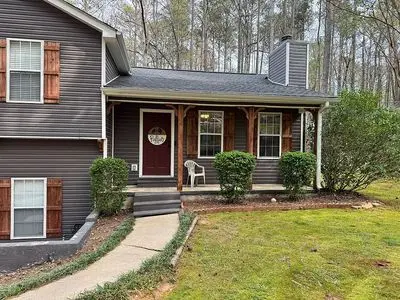
48 E Mourning Dove Ct · Monticello, GA
Flood risk 1/10 · Minimal
- FEMA flood zone
- X (unshaded)
- Chance of flooding over 30 yrs
- 0.0%
- Est. flood insurance / yr
- $473 – $860
Fire risk 3/10 · Minor
- Est. fire insurance / yr
- $963 – $1,789
Heat risk 6/10 · Moderate
- Hot days now (above 107°F)
- 7 days/yr
- Hot days in 30 yrs
- 17 days/yr
Wind risk 6/10 · Moderate
- Chance of severe wind over 30 yrs
- 27.0%
Air-quality risk 4/10 · Minor
- Unhealthy air days now
- 4 days/yr
- Unhealthy air days in 30 yrs
- 5 days/yr
Risk factors via First Street. Map © Google.
Why this score? — see what drove the D- grade
The composite is a weighted blend of 9 inputs, each scored 0–100. Each bar is that input's sub-score; the figure is the points it added to the 100-point composite (weight × sub-score).
- Appreciation +10.0/10.0
- Cash flow +7.9/30.0
- ARV discount +4.4/15.0
- Livability +4.0/5.0
- Rent growth +2.5/5.0
- Condition / age +2.5/5.0
- Schools +2.3/10.0
- DSCR +1.9/10.0
- 1% rule +1.8/10.0
$290,000
🖨 Deal sheet 📄 Offer letter ✓ Due diligence
Listing remarks
Welcome to this beautifully maintained ready to move in 3-bedroom, 2-bath home located in the highly sought-after Turtle Cove community! Offering approximately 1,600 square feet of comfortable living space, this home is the perfect blend of charm, functionality, and recent updates. Step inside to find a clean, inviting interior with updated flooring and carpet (just 2 years old), giving the home a fresh and move-in ready feel. The spacious living room features a cozy fireplace, creating the perfect spot to relax or gather with family. The layout flows easily into a functional kitchen and dining area, ideal for both everyday living and entertaining. This home also includes a heated and coole
Key facts
- Built 2003
Neighborhood map
What this means for you Summary
Snapshot
- This is a 3-bed/2.0-bath single-family listed at $290k.
Deal economics
- At list price, monthly cash flow is $-315 ($-4k/yr) — negative.
- To cash-flow at today's rent, offer at most $234k (19.2% below list).
- To meet the 1% rule (rent ≥ 1% of price), the offer needs to be $198k (31.7% below list).
- Recommended offer: $198k (31.7% below list) — sets the bar for 1% rule.
- Cap rate 5.0% vs local median 3.9% in Monticello — meaningfully above typical; check what's discounted (condition, days-on-market, listing class) to confirm the premium yield is real.
Location & tenants
- Location reads 79/100 on livability (#16 in GA, #2,229 nationally) — a middle-class / working-renter tenant base. Strengths: crime A+, cost of living A+, housing A+; Watch: amenities C-, employment D+, schools F.
- Jasper County (rural): math 24% / reading 30% proficiency, ranked #113 of 174 in GA (top 65%) — low school quality limits family demand, transient renter base, plan for 1-2y turnover; 60% free/reduced lunch — lower-income household profile, screen leases tightly.
- Market conditions: 174 active listings in the ZIP; 183 units permitted in Jasper County in 2024 (0 in 5+ unit buildings).
Forward outlook
- In year one you build about $31k of equity ($2k loan paydown + $29k appreciation (10.0% local appreciation)).
- Jasper County population projected at -24% by 2050 — secular population decline; favor cash flow + early exit over multi-decade hold.
- By year 2, paydown + projected appreciation supports a ~$50k cash-out refi (75% LTV) — recoverable capital for the next deal without selling this one.
Negotiation context
- Only 0 days on market — expect competitive offers; lowballing is unlikely to land.
- Current owner paid $80k; list at $290k implies a 262% gain — meaningful room to come down on a strong offer.
Risks & watch-outs
- Climate carrying-cost: major wind risk, 27% chance of damaging wind over 30y; extreme-heat days projected 7→17/yr by 2055 (HVAC capex compounding) — expect insurance premiums to compound above CPI over the hold.
Questions for the listing agent
- What do current leases actually rent for vs. the listed asking? Can we see a recent rent roll and the last 12 months of T-12 income?
- Is there a deadline driving the sale (1031 exchange, divorce, estate, relocation)? That informs how much negotiation room exists.
- Schools are F-rated, which usually means shorter tenancies and higher turnover. Who's the typical renter profile here, and what's been the actual vacancy rate?
- The area grade is low — what's the realistic commute time and amenity access for the typical tenant pool here? Any planned neighborhood developments (good or bad) we should know about?
- What's the average days-on-market for RENTAL listings here right now (not sales)? A rising rental-DOM trend means longer vacancies and softer asking-rent achievability than the comps imply.
- What's the recent tenant-quality profile in this submarket — average credit score on applications, eviction rate, late-payment / NSF rate, and stable-employment percentage? A property-management company in the area should have these aggregated.
- How much new for-sale + rental construction is in the pipeline within 1–3 miles? Heavy new supply typically softens prices + rents 12–24 months out; constrained supply supports both.
Investment metrics
- 1% rule
- 0.68% ✗
- Cap rate
- 4.99%
- Cash-on-cash
- -4.66%
- DSCR
- 0.79
- GRM
- 12.2
CMA / ARV
- ARV (on-the-fly)
- $271,094
- Comps found
- 12
Show comp detail 12 sales within ~0.75 mi
| Address | Dist | Beds/Ba | Sqft | Sold | Price | $/sf | Match |
|---|---|---|---|---|---|---|---|
| 765 Whip-poor-will Rd | 0.14mi | 3/2.0 | 1,549 (+2%) | 3mo | $275,000 | $178 | 88 |
| 1009 Whip-poor-will Rd | 0.34mi | 3/2.0 | 1,504 (-1%) | 12mo | $250,000 | $166 | 72 |
| 281 Mockingbird Dr | 0.39mi | 3/2.0 | 1,624 (+7%) | 3mo | $185,000 | $114 | 68 |
| 56 Starling Dr | 0.19mi | 3/2.0 | 1,404 (-8%) | 14mo | $175,000 | $125 | 67 |
| 170 Loon Trl | 0.27mi | 3/2.0 | 1,684 (+11%) | 6mo | $240,000 | $143 | 64 |
| 111 Turtle Cv | 0.38mi | 3/2.0 | 1,339 (-12%) | 1mo | $284,000 | $212 | 61 |
| 433 E Mourning Dove Ct | 0.34mi | 3/2.0 | 1,304 (-14%) | 3mo | $250,000 | $192 | 57 |
| 716 E Mourning Dove Ct | 0.45mi | 3/2.0 | 1,320 (-13%) | 0mo | $304,900 | $231 | 56 |
| 512 Lakeshore Dr | 0.55mi | 3/2.0 | 1,400 (-8%) | 7mo | $385,000 | $275 | 55 |
| 372 Waxwing Dr | 0.65mi | 3/2.0 | 1,449 (-5%) | 12mo | $290,130 | $200 | 51 |
| 79 Davis St | 0.59mi | 2/1.5 (-1) | 1,408 (-8%) | 4mo | $200,000 | $142 | 50 |
| 515 Waxwing Dr | 0.63mi | 4/2.0 (+1) | 1,620 (+6%) | 12mo | $235,000 | $145 | 45 |
Match score weights: distance 35% · size 25% · config 20% · recency 20%. Top-matched comps best support the ARV.
Projected returns pro-forma
10.0% appreciation · 3.0% rent growth · sell at horizon
- IRR
- 21.0%
- Equity multiple
- 2.70×
- Total profit
- $137,804
- Equity at exit
- $261,255
- IRR
- 19.0%
- Equity multiple
- 6.19×
- Total profit
- $421,521
- Equity at exit
- $563,406
Cash invested: $81,200 (down + closing). Projections, not guarantees.
Landlord ↔ Tenant lean methodology
- Overall (STATE)
- 90 Strongly Landlord-Friendly
- State Georgia
- 90 Strongly Landlord-Friendly · R+3
- County
- — inherits STATE
- City
- — inherits STATE
ZIP-level market 31064
- Home prices YoY
- 16.0%
- Active inventory
- 174
- Price-to-rent
- 12.2×
Monthly cashflow live
- Estimated rent
- $1,982 medium interval (Pro) →
- Mortgage (P&I)
- −$1,521
- Tax from tax record
- −$240 /mo · $2,874/yr
- Insurance
- −$121
- HOA
- −$0
- Vacancy / Maint / Mgmt
- −$416
- Net cashflow
- $-315
Break-even live
UW: 25.0% down · 7.5% · 30yr · 1.5% tax · 5.0% vac · 8.0% maint · 8.0% mgmt
Financing live
Cash to close
- Down payment
- $72,500
- Closing costs
- $8,700
- Reserves months
- —
- Total cash needed
- —
Loan-product check · same deal, 3 products live
Conventional
25% down · 7.5% · 30yr
- Down + closing
- —
- Monthly P&I
- —
- Monthly cashflow
- —
- DSCR
- —
- Eligible?
- —
Personal DTI + credit; lowest rate.
DSCR
20% down · 8.5% · 30yr
- Down + closing
- —
- Monthly P&I
- —
- Monthly cashflow
- —
- DSCR
- —
- Eligible?
- —
No personal income docs; deal must DSCR.
Hard money
10% down · 12.0% · 12mo
- Down + closing
- —
- Monthly P&I
- —
- Monthly cashflow
- —
- DSCR
- —
- Eligible?
- —
Short-term bridge; refi at stabilization.
Listing history 7 events
-
2026-05-26$290,000
-
2022-10-21soldstatus $80,000
-
2010-05-29price $44,800 Reduced
-
2010-05-08price $69,300 Reduced
-
2010-02-27price $79,200 Reduced
-
2010-01-30price $89,100 Reduced
-
2002-10-15soldstatus $100,000
ⓘ Source: listings_history table (triggers on properties + properties_extension) + one-shot
backfill from property_details.listing_events for pre-trigger history.
Tax reassessment forecast GA · Resets to sale price
- Current annual tax
- $2,874 · $240/mo
- Projected year-2 tax
- $2,874 · $240/mo
- Expected delta
- $0/yr ($0/mo · 0.0%)
ⓘ Screening estimate from a state-policy table — verify with the county assessor before closing.
Climate risk First Street
- Flood 1/10 Low FEMA zone X (unshaded) · 0% chance over 30 yrs
- Wildfire 3/10 Moderate
- Heat 6/10 Major 7 d/yr ≥107°F today · 17 d/yr by 30 yrs out
- Wind 6/10 Major 27% chance of damaging wind over 30 yrs
- Air quality 4/10 Moderate 4 unhealthy d/yr today · 5 by 30 yrs out
Nearby sold comps map
Loading sold comps map…
Walkable amenities ~0.75 mi
Loading nearby amenities…
Taxation est. · year 1
- Rental income
- $23,783
- − Mortgage interest
- −$16,245
- − Property taxes
- −$2,874
- − Insurance
- −$1,450
- − Repairs & maintenance
- −$1,903
- − Management
- −$1,903
- − Depreciation
- −$8,436
- Taxable loss
- −$9,028
- Est. tax savings @ 24.0%
- +$2,167
- After-tax cash flow
- $-1,619/yr
For passive investors: Depreciation is non-cash, so a rental often shows a tax loss while cash-flowing — sheltering income. Rental losses are passive: they offset passive income freely, and up to $25,000/yr can offset ordinary (W-2) income if you actively participate and your MAGI is under $100k (phasing out to $0 by $150k); unused losses carry forward. On sale, claimed depreciation is recaptured at up to 25%, and gains may owe capital-gains tax (a 1031 exchange can defer both). Figures are a year-1 estimate at your 24.0% rate — not tax advice; consult a CPA.
Schools (NCES district)
- District
- Jasper County
- NCES district ID
- 1302970
- Math proficiency
- 24% ▼ -12.00%
- Reading proficiency
- 30% ▼ -6.00%
- Median HH income
- $42,606
- Composite
- 22.99/100
- National rank
- #7980
- State rank
- #113 of 174 in GA
Livability — Monticello
- Score
- 79/100
- State rank
- #16
- US rank
- #2229
Category grades
Schools grade is shown separately in the Schools card above.
Census & demographics
- Population (ZIP)
- 9,859
Population outlook (Jasper County) Hauer SSP2
- Today (2025)
- 13,020 people
- By 2030
- 12,538 · -3.7%
- By 2040
- 11,355 · -12.8%
- By 2050
- 9,955 · -23.5%
- By 2075
- 6,646 · -49.0%
- By 2100
- 4,022 · -69.1%
Race, ethnicity, and origin ACS 2023
- Neighborhood character
- Predominantly White (71%)
- Race & ethnicity
- White 71% Black 21% Hispanic / Latino 5% Two or more races 4%
- Common ancestry
- Slovak 3% Serbian 2% Italian 1%
- Foreign-born
- 2% · Canada
- Languages at home
- 97% English-only · Spanish 3%
Political lean MEDSL · Jasper
- 2024 margin
- Solid R (+58.4) · D 20.6% · R 79.0%
- 2008→2024 swing
- -24.8pp toward R · 2008: -33.6pp · 2024: -58.4pp
- All cycles
- 2024: R+58.4 2020: R+53.1 2016: R+46.7 2012: R+38.0 2008: R+33.6
Not yet ingested
- Civics
- —
Market trends
- HPI YoY
- ▲ 58.00%
- Current HPI
- 420.9288
- Rent YoY
- —
- Metro
- —
- State GDP YoY
- ▲ 2.66%
- F500 in state
- 28
Industry mix (Fortune 500 HQ in GA)
| Industry | F500 HQs | Revenue |
|---|---|---|
| Paper / Packaging | 2 | $29B |
|
||
| Retail | 1 | $160B |
|
||
| Transportation / Logistics | 1 | $91B |
|
||
| Airlines | 1 | $62B |
|
||
| Consumer Goods | 1 | $47B |
|
||
| Utilities | 1 | $25B |
|
||
Price history
+190.0% since first listed7 events — show timeline
- 2026-05-26 Listed $290,000 FSBO.com
- 2022-10-21 Sold (Public Records) $80,000 Public Records
- 2010-05-29 Price Changed $44,800 GAMLS
- 2010-05-08 Price Changed $69,300 GAMLS
- 2010-02-27 Price Changed $79,200 GAMLS
- 2010-01-30 Price Changed $89,100 GAMLS
- 2002-10-15 Sold (Public Records) $100,000 Public Records
Property tax history
+3.6%/yrLatest (2025): $2,874 · +7.7% YoY. Source: county tax records.
Cash-flow waterfall
monthlySold comps — $/sqft
last 12 mo · ≤1 miLoading sold comps…