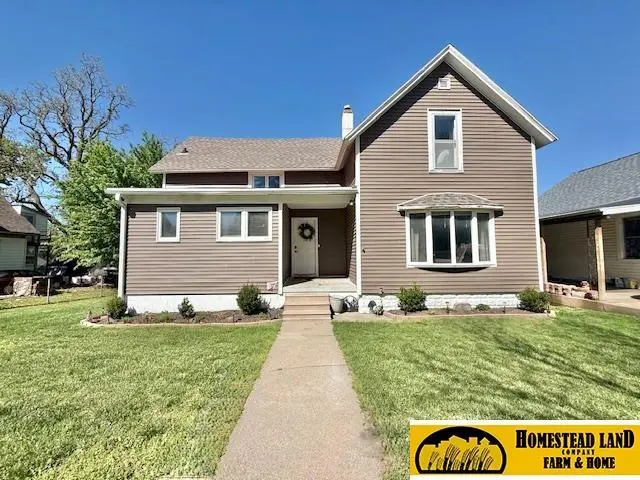
1105 B St
Fairbury, NE 68352
$130,000C-
4 bd · 1.0 ba ·
1,570 sqft ·
Built 1890
· SingleFamily
· Pending
· 6 DOM
Cashflow @ list (25.0% down · 7.5%)
Estimated rent
$1,181/mo
Mortgage (P&I)
−$682
Tax + insurance
−$140
HOA
−$0
Vac / Maint / Mgmt
−$248
Net cashflow
$111/mo
Annual
$1,331/yr
Cap rate
7.32%
Cash-on-cash
3.66%
DSCR
1.16
1% rule
0.91%
Cash to close
$36,400
Investor read
- This is a 4-bed/1.0-bath single-family listed at $130k.
- At list price, monthly cash flow is $111 ($1k/yr) — positive.
- The deal already cash-flows at list — no discount required.
- To meet the 1% rule (rent ≥ 1% of price), the offer needs to be $118k (9.2% below list).
- Only 6 days on market — expect competitive offers; lowballing is unlikely to land.
- Recommended offer: $118k (9.2% below list) — sets the bar for 1% rule.
- Local home prices are declining (-3.0%/yr); year-one equity from $899 of loan paydown is wiped out by about $4k of value loss. Plan a longer hold.
- Location reads 74/100 on livability (#125 in NE, #4,843 nationally) — a middle-class / working-renter tenant base. Strengths: cost of living A+, housing A+, health & safety A+; Watch: employment D+, amenities F, commute F.
- Fairbury Public Schools (town): math 39% / reading 37% proficiency, ranked #101 of 111 in NE (top 91%) — families likely to look elsewhere, expect single-tenant / working-renter base with shorter leases.
- Zoned schools: Central Elementary School (262 students, 56% FRL); Fairbury Jr-Sr High School (math 42% / reading 42%, grade F, #176 of 261 statewide, top 68%, 377 students, 55% FRL) — zoned schools average 55% FRL vs 39% district-wide (16 pts higher); higher-poverty schools than district average — tighter screening recommended.
- Watch-outs: built in 1890 — expect roof / HVAC / electrical / plumbing capex.
- Market conditions: 37 active listings in the ZIP; 9 units permitted in Jefferson County in 2024 (0 in 5+ unit buildings).
- Jefferson County population projected to shrink 6% by 2050 — rents likely to lag national; underwrite the cash flow, not the appreciation.
- 2 sale attempts since 16y ago with the ask held roughly flat each time — persistent listings suggest the price (not the market) is what's stuck; bring a comps-based counter.
- Climate carrying-cost: major wildfire risk — expect insurance premiums to compound above CPI over the hold.
- Cap rate 7.3% vs local median 4.6% in Fairbury — top-decile yield for the area; either an underpriced asset or a hidden risk that comps aren't pricing in. Stress-test before assuming the spread holds.
Questions for listing agent
- Built in 1890 — when were the roof, HVAC, electrical panel, plumbing, and water heater last replaced?
- Is there a deadline driving the sale (1031 exchange, divorce, estate, relocation)? That informs how much negotiation room exists.
- Schools are D-rated, which usually means shorter tenancies and higher turnover. Who's the typical renter profile here, and what's been the actual vacancy rate?
- What's the average days-on-market for RENTAL listings here right now (not sales)? A rising rental-DOM trend means longer vacancies and softer asking-rent achievability than the comps imply.
- What's the recent tenant-quality profile in this submarket — average credit score on applications, eviction rate, late-payment / NSF rate, and stable-employment percentage? A property-management company in the area should have these aggregated.
- How much new for-sale + rental construction is in the pipeline within 1–3 miles? Heavy new supply typically softens prices + rents 12–24 months out; constrained supply supports both.
CashFlowRE · CFR-8MC4431SEQXC1N
· Data 3 weeks ago
cashflowre.app · 2026-05-29