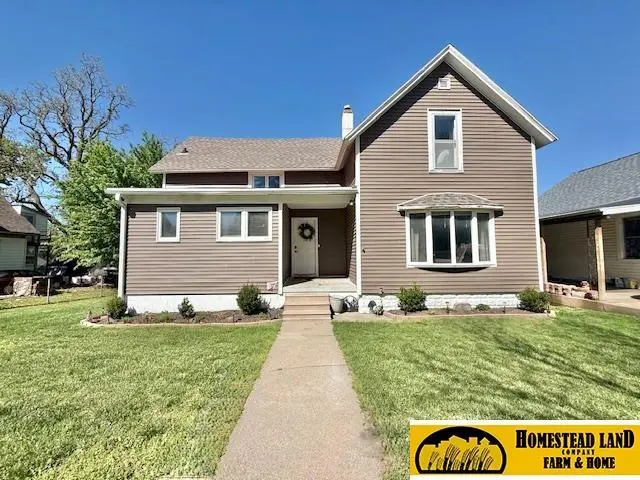
1105 B St · Fairbury, NE
Flood risk 1/10 · Minimal
- FEMA flood zone
- X (unshaded)
- Chance of flooding over 30 yrs
- 0.0%
- Est. flood insurance / yr
- $473 – $860
Fire risk 6/10 · Moderate
- Est. fire insurance / yr
- $1,161 – $2,155
Heat risk 4/10 · Minor
- Hot days now (above 105°F)
- 7 days/yr
- Hot days in 30 yrs
- 16 days/yr
Wind risk 2/10 · Minimal
- Chance of severe wind over 30 yrs
- —
Air-quality risk 1/10 · Minimal
- Unhealthy air days now
- 0 days/yr
- Unhealthy air days in 30 yrs
- 0 days/yr
Risk factors via First Street. Map © Google.
Why this score? — see what drove the C- grade
The composite is a weighted blend of 9 inputs, each scored 0–100. Each bar is that input's sub-score; the figure is the points it added to the 100-point composite (weight × sub-score).
- Cash flow +18.0/30.0
- ARV discount +15.0/15.0
- DSCR +5.6/10.0
- 1% rule +4.1/10.0
- Livability +3.7/5.0
- Schools +3.2/10.0
- Rent growth +2.5/5.0
- Condition / age +2.5/5.0
- Appreciation +0.0/10.0
$130,000
🖨 Deal sheet (PDF) 📄 Offer letter ✓ Due diligence
Listing remarks MLS
Nice 3+ bedroom home, updated kitchen , Dec nice large bak yard to see call Frank at 402.658.5630
Key facts
- Covered deck
- Alley access
- Room for a garden
Tags
Property features AI
Exterior
- Parking: No garage
- Utilities: Public water; Public sewer; Electricity available; Natural gas available
- Home design: Single-family residence; One and one-half stories; Not new / not a model
- Construction: Vinyl siding; Composition roof; Block foundation; Built in 1890
- Exterior features: Porch; Covered deck; Shed(s); City lot with public sidewalk and alley; Up to 1/4 acre lot (approx. 0.21 acre, 63.25 x 142 ft)
Interior
- Kitchen: Luxury vinyl plank flooring
- Bedrooms: Master bedroom (2nd floor) with ceiling fan and luxury vinyl plank flooring, approx. 14 x 15; Bedroom 2 (2nd floor) with ceiling fan, walk-in closet and luxury vinyl plank flooring, approx. 9 x 10; Bedroom 3 (main floor) with ceiling fan and luxury vinyl plank flooring, approx. 13 x 10; Bedroom 4 (main floor) with wall-to-wall carpeting, approx. 13 x 10
- Flooring: Luxury vinyl plank; Vinyl; Ceramic tile; Carpet; Plank
- Bathrooms: 2 total bathrooms — 1 full, 1 half; Main floor has a bathroom
- Heating & cooling: Natural gas forced air heating; Central air conditioning
- Interior features: Ceiling fans; Sliding doors
- Laundry & utility: Washer and dryer included; Laundry area with ceramic tile floor
Neighborhood map
What this means for you Summary
Snapshot
- This is a 4-bed/1.0-bath single-family listed at $130k.
Deal economics
- At list price, monthly cash flow is $111 ($1k/yr) — positive.
- The deal already cash-flows at list — no discount required.
- To meet the 1% rule (rent ≥ 1% of price), the offer needs to be $118k (9.2% below list).
- Recommended offer: $118k (9.2% below list) — sets the bar for 1% rule.
- Cap rate 7.3% vs local median 4.6% in Fairbury — top-decile yield for the area; either an underpriced asset or a hidden risk that comps aren't pricing in. Stress-test before assuming the spread holds.
Location & tenants
- Location reads 74/100 on livability (#125 in NE, #4,843 nationally) — a middle-class / working-renter tenant base. Strengths: cost of living A+, housing A+, health & safety A+; Watch: employment D+, amenities F, commute F.
- Fairbury Public Schools (town): math 39% / reading 37% proficiency, ranked #101 of 111 in NE (top 91%) — families likely to look elsewhere, expect single-tenant / working-renter base with shorter leases.
- Zoned schools: Central Elementary School (262 students, 56% FRL); Fairbury Jr-Sr High School (math 42% / reading 42%, grade F, #176 of 261 statewide, top 68%, 377 students, 55% FRL) — zoned schools average 55% FRL vs 39% district-wide (16 pts higher); higher-poverty schools than district average — tighter screening recommended.
- Market conditions: 37 active listings in the ZIP; 9 units permitted in Jefferson County in 2024 (0 in 5+ unit buildings).
Forward outlook
- Local home prices are declining (-3.0%/yr); year-one equity from $899 of loan paydown is wiped out by about $4k of value loss. Plan a longer hold.
- Jefferson County population projected to shrink 6% by 2050 — rents likely to lag national; underwrite the cash flow, not the appreciation.
Negotiation context
- Only 6 days on market — expect competitive offers; lowballing is unlikely to land.
- 2 sale attempts since 16y ago with the ask held roughly flat each time — persistent listings suggest the price (not the market) is what's stuck; bring a comps-based counter.
Risks & watch-outs
- Watch-outs: built in 1890 — expect roof / HVAC / electrical / plumbing capex.
- Climate carrying-cost: major wildfire risk — expect insurance premiums to compound above CPI over the hold.
Questions for the listing agent
- Built in 1890 — when were the roof, HVAC, electrical panel, plumbing, and water heater last replaced?
- Is there a deadline driving the sale (1031 exchange, divorce, estate, relocation)? That informs how much negotiation room exists.
- Schools are D-rated, which usually means shorter tenancies and higher turnover. Who's the typical renter profile here, and what's been the actual vacancy rate?
- What's the average days-on-market for RENTAL listings here right now (not sales)? A rising rental-DOM trend means longer vacancies and softer asking-rent achievability than the comps imply.
- What's the recent tenant-quality profile in this submarket — average credit score on applications, eviction rate, late-payment / NSF rate, and stable-employment percentage? A property-management company in the area should have these aggregated.
- How much new for-sale + rental construction is in the pipeline within 1–3 miles? Heavy new supply typically softens prices + rents 12–24 months out; constrained supply supports both.
Investment metrics
- 1% rule
- 0.91% ✗
- Cap rate
- 7.32%
- Cash-on-cash
- 3.66%
- DSCR
- 1.16
- GRM
- 9.2
CMA / ARV
- ARV (median comp)
- $186,799
- List price
- $130,000
- Delta
- -30.41%
- Verdict
- UNDERPRICED
- Comps
- 20 within 1.0 mi
Show comp detail 9 sales within ~0.75 mi
| Address | Dist | Beds/Ba | Sqft | Sold | Price | $/sf | Match |
|---|---|---|---|---|---|---|---|
| 1103 E St | 0.21mi | 3/2.0 (-1) | 1,684 (+7%) | 7mo | $125,000 | $74 | 64 |
| 1415 H St | 0.50mi | 4/2.0 | 1,632 (+4%) | 6mo | $228,000 | $140 | 61 |
| 714 8th St | 0.51mi | 3/2.0 (-1) | 1,553 (-1%) | 13mo | $118,000 | $76 | 55 |
| 912 8th St | 0.64mi | 3/1.5 (-1) | 1,600 (+2%) | 8mo | $20,000 | $13 | 53 |
| 1119 H St | 0.43mi | 4/1.5 | 1,732 (+10%) | 11mo | $138,900 | $80 | 51 |
| 621 7th St | 0.49mi | 3/2.0 (-1) | 1,452 (-8%) | 8mo | $70,000 | $48 | 49 |
| 1302 A St | 0.16mi | 3/1.0 (-1) | 1,346 (-14%) | 24mo | $135,000 | $100 | 44 |
| 1205 F St | 0.30mi | 3/2.0 (-1) | 1,390 (-12%) | 20mo | $60,000 | $43 | 41 |
| 1811 Mendenhall Ave | 0.58mi | 3/2.0 (-1) | 1,434 (-9%) | 12mo | $259,900 | $181 | 40 |
Match score weights: distance 35% · size 25% · config 20% · recency 20%. Top-matched comps best support the ARV.
Projected returns pro-forma
-3.0% appreciation · 3.0% rent growth · sell at horizon
- IRR
- -10.6%
- Equity multiple
- 0.61×
- Total profit
- $-14,032
- Equity at exit
- $19,383
- IRR
- -1.3%
- Equity multiple
- 0.91×
- Total profit
- $-3,243
- Equity at exit
- $11,240
Cash invested: $36,400 (down + closing). Projections, not guarantees.
Landlord ↔ Tenant lean methodology
- Overall (STATE)
- 83 Strongly Landlord-Friendly
- State Nebraska
- 83 Strongly Landlord-Friendly · R+13
- County
- — inherits STATE
- City
- — inherits STATE
ZIP-level market 68352
- Home prices YoY
- -9.9%
- Active inventory
- 37
- Price-to-rent
- 9.2×
Monthly cashflow live
- Estimated rent
- $1,181 medium interval (Pro) →
- Mortgage (P&I)
- −$682
- Tax from tax record
- −$86 /mo · $1,032/yr
- Insurance
- −$54
- HOA
- −$0
- Vacancy / Maint / Mgmt
- −$248
- Net cashflow
- $111
Break-even live
Sensitivity live
| Price | -10% $184 | -5% $148 | +0% $111 | +5% $74 | +10% $37 |
|---|---|---|---|---|---|
| Rent | -10% $18 | -5% $64 | +0% $111 | +5% $158 | +10% $204 |
| Rate | -1.0pp $176 | -0.5pp $144 | base $111 | +0.5pp $77 | +1.0pp $43 |
UW: 25.0% down · 7.5% · 30yr · 1.5% tax · 5.0% vac · 8.0% maint · 8.0% mgmt
Financing live
Cash to close
- Down payment
- $32,500
- Closing costs
- $3,900
- Reserves months
- —
- Total cash needed
- —
Loan-product check · same deal, 3 products live
Conventional
25% down · 7.5% · 30yr
- Down + closing
- —
- Monthly P&I
- —
- Monthly cashflow
- —
- DSCR
- —
- Eligible?
- —
Personal DTI + credit; lowest rate.
DSCR
20% down · 8.5% · 30yr
- Down + closing
- —
- Monthly P&I
- —
- Monthly cashflow
- —
- DSCR
- —
- Eligible?
- —
No personal income docs; deal must DSCR.
Hard money
10% down · 12.0% · 12mo
- Down + closing
- —
- Monthly P&I
- —
- Monthly cashflow
- —
- DSCR
- —
- Eligible?
- —
Short-term bridge; refi at stabilization.
Listing history 8 events
-
2026-05-03status Pending 586-char remark
-
2026-04-27$130,000 New 586-char remark
-
2021-09-10soldstatus $50,000
-
2011-05-20soldstatus $29,000 97-char remark
Show marketing remark (97 chars)
Nice 3+ bedroom home, updated kitchen , Dec nice large bak yard to see call Frank at 402.658.5630
-
2011-05-18soldstatus $29,000
-
2010-09-07$35,900 97-char remark
Show marketing remark (97 chars)
Nice 3+ bedroom home, updated kitchen , Dec nice large bak yard to see call Frank at 402.658.5630
-
2006-03-21soldstatus $26,500
-
2003-11-20soldstatus $53,560
ⓘ Source: listings_history table (triggers on properties + properties_extension) + one-shot
backfill from property_details.listing_events for pre-trigger history.
Tax reassessment forecast NE · Resets to sale price
- Current annual tax
- $1,032 · $86/mo
- Projected year-2 tax
- $2,249 · $187/mo
- Expected delta
- +$1,217/yr (+$101/mo · 118.0%)
ⓘ Screening estimate from a state-policy table — verify with the county assessor before closing.
Climate risk First Street
- Flood 1/10 Low FEMA zone X (unshaded) · 0% chance over 30 yrs
- Wildfire 6/10 Major
- Heat 4/10 Moderate 7 d/yr ≥105°F today · 16 d/yr by 30 yrs out
- Wind 2/10 Low
- Air quality 1/10 Low 0 unhealthy d/yr today · 0 by 30 yrs out
Nearby sold comps map
Loading sold comps map…
Walkable amenities ~0.75 mi
Loading nearby amenities…
Taxation est. · year 1
- Rental income
- $14,169
- − Mortgage interest
- −$7,282
- − Property taxes
- −$1,032
- − Insurance
- −$650
- − Repairs & maintenance
- −$1,133
- − Management
- −$1,133
- − Depreciation
- −$3,782
- Taxable loss
- −$844
- Est. tax savings @ 24.0%
- +$203
- After-tax cash flow
- $1,533/yr
For passive investors: Depreciation is non-cash, so a rental often shows a tax loss while cash-flowing — sheltering income. Rental losses are passive: they offset passive income freely, and up to $25,000/yr can offset ordinary (W-2) income if you actively participate and your MAGI is under $100k (phasing out to $0 by $150k); unused losses carry forward. On sale, claimed depreciation is recaptured at up to 25%, and gains may owe capital-gains tax (a 1031 exchange can defer both). Figures are a year-1 estimate at your 24.0% rate — not tax advice; consult a CPA.
Schools (NCES district)
- District
- Fairbury Public Schools
- NCES district ID
- 3170440
- Math proficiency
- 39% ▼ -13.00%
- Reading proficiency
- 37% ▲ 4.00%
- Median HH income
- $40,800
- Composite
- 31.97/100
- National rank
- #5842
- State rank
- #101 of 111 in NE
Livability — Fairbury
- Score
- 74/100
- State rank
- #125
- US rank
- #4843
Category grades
Schools grade is shown separately in the Schools card above.
Census & demographics
- Census place
- Fairbury, NE
- Population (ZIP)
- 4,897
Population outlook (Jefferson County) Hauer SSP2
- Today (2025)
- 6,961 people
- By 2030
- 6,831 · -1.9%
- By 2040
- 6,590 · -5.3%
- By 2050
- 6,510 · -6.5%
- By 2075
- 6,831 · -1.9%
- By 2100
- 7,072 · +1.6%
Race, ethnicity, and origin ACS 2023
- Neighborhood character
- Predominantly White (88%)
- Race & ethnicity
- White 88% Hispanic / Latino 7% Two or more races 6%
- Hispanic origin (detail)
- Mexican 5%
- Common ancestry
- Lithuanian 3% Iranian 1% Italian 1%
- Foreign-born
- 2% · Canada
- Languages at home
- 95% English-only · Spanish 4% German/W. Germanic 1%
Political lean MEDSL · Jefferson
- 2024 margin
- Solid R (+45.3) · D 26.7% · R 72.0% · Other 1.4%
- 2008→2024 swing
- -29.6pp toward R · 2008: -15.8pp · 2024: -45.3pp
- All cycles
- 2024: R+45.3 2020: R+42.9 2016: R+45.4 2012: R+28.4 2008: R+15.8
Not yet ingested
- Civics
- —
Market trends
- HPI YoY
- ▼ -25.22%
- Current HPI
- 229.7519
- Rent YoY
- —
- Metro
- —
- State GDP YoY
- ▲ 0.68%
- F500 in state
- 2
Industry mix (Fortune 500 HQ in NE)
| Industry | F500 HQs | Revenue |
|---|---|---|
| Conglomerate | 1 | $371B |
|
||
Price history
+128.2% since first listed9 events — show timeline
- 2026-06-12 Sold (MLS) $122,250 GPRMLS
- 2026-05-03 Pending — GPRMLS
- 2026-04-27 Listed $130,000 GPRMLS
- 2021-09-10 Sold (Public Records) $50,000 Public Records
- 2011-05-20 Sold (MLS) $29,000 GPRMLS
- 2011-05-18 Sold (Public Records) $29,000 Public Records
- 2010-09-07 Listed $35,900 GPRMLS
- 2006-03-21 Sold (Public Records) $26,500 Public Records
- 2003-11-20 Sold (Public Records) $53,560 Public Records
Property tax history
+3.9%/yrLatest (2025): $1,032 · -8.5% YoY. Source: county tax records.
Cash-flow waterfall
monthlySold comps — $/sqft
last 12 mo · ≤1 miLoading sold comps…