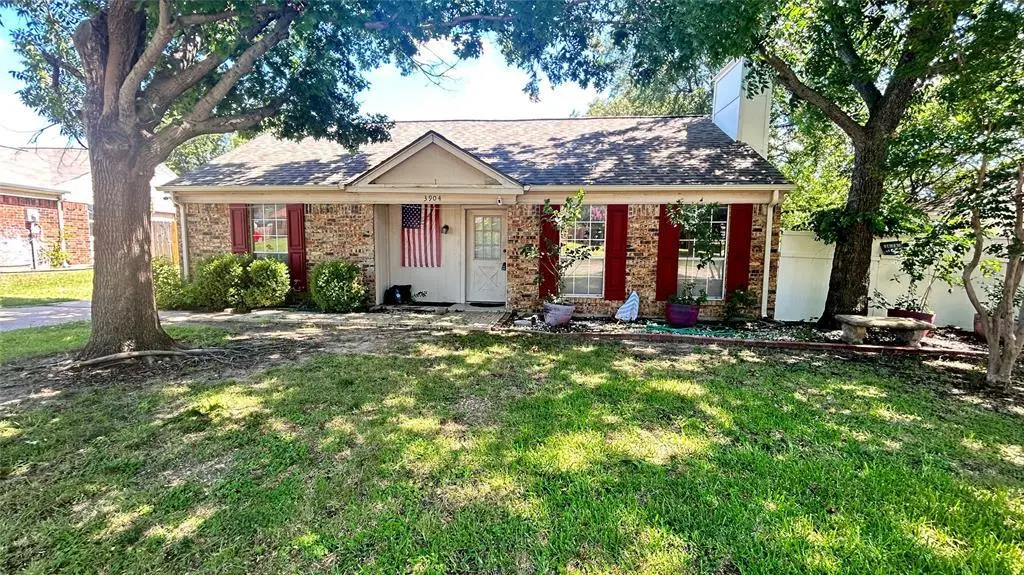
3904 Manzinita St
Fort Worth, TX 76137
$199,900D+
3 bd · 2.0 ba ·
1,022 sqft ·
Built 1983
· SingleFamily
· Active
· 3 DOM
Cashflow @ list (25.0% down · 7.5%)
Estimated rent
$1,899/mo
Mortgage (P&I)
−$1,048
Tax + insurance
−$479
HOA
−$0
Vac / Maint / Mgmt
−$399
Net cashflow
$-27/mo
Annual
$-325/yr
Cap rate
6.13%
Cash-on-cash
-0.58%
DSCR
0.97
1% rule
0.95%
Cash to close
$55,972
Investor read
- This is a 3-bed/2.0-bath single-family listed at $200k.
- At list price, monthly cash flow is $-27 ($-325/yr) — negative.
- To cash-flow at today's rent, offer at most $195k (2.4% below list).
- To meet the 1% rule (rent ≥ 1% of price), the offer needs to be $190k (5.0% below list).
- Only 3 days on market — expect competitive offers; lowballing is unlikely to land.
- Recommended offer: $190k (5.0% below list) — sets the bar for 1% rule.
- Local home prices are declining (-3.0%/yr); year-one equity from $1k of loan paydown is wiped out by about $6k of value loss. Plan a longer hold.
- Location reads 80/100 on livability (#49 in TX, #1,954 nationally) — a professional / high-income tenant draw. Strengths: amenities A+, cost of living A+, housing A+; Watch: crime F.
- Keller ISD (urban): math 50% / reading 54% proficiency, ranked #91 of 826 in TX (top 11%) — acceptable for families but not a draw, mixed tenant base, ~2y average lease; only 19% free/reduced lunch — higher-income household profile.
- Zoned schools: North Riverside El (math 25% / reading 33%, grade F, #2,668 of 4,322 statewide, top 63%, 488 students, 70% FRL); Fossil Hill Middle (math 32% / reading 43%, grade F, #736 of 1,662 statewide, top 45%, 838 students, 61% FRL); Fossil Ridge H S (math 41% / reading 55%, grade D, #571 of 1,632 statewide, top 36%, 2,329 students, 51% FRL) — zoned schools average 60% FRL vs 19% district-wide (42 pts higher); higher-poverty schools than district average — tighter screening recommended.
- Zoned-school proficiency averages 38% at this address vs 52% district-wide (-14 pts) — the specific schools serving this property underperform the Keller ISD average; the district grade overstates school quality for this exact location.
- Market conditions: Rents soft (-1.4%/yr); 212 active listings in the ZIP; 40 comparable units currently listed for rent nearby; rentals at typical pace (median 15d on market — plan ~3-4 weeks tenant-placement turnaround); solid renter incomes; 18,938 units permitted in Tarrant County in 2024 (8,336 in 5+ unit buildings).
- Tarrant County population projected at +41% by 2050 — long-run rental-demand tailwind backs the buy-and-hold thesis.
- Climate carrying-cost: extreme-heat days projected 7→23/yr by 2055 (HVAC capex compounding) — expect insurance premiums to compound above CPI over the hold.
- Cap rate 6.1% vs local median 3.9% in Fort Worth — top-decile yield for the area; either an underpriced asset or a hidden risk that comps aren't pricing in. Stress-test before assuming the spread holds.
Questions for listing agent
- What do current leases actually rent for vs. the listed asking? Can we see a recent rent roll and the last 12 months of T-12 income?
- Is there a deadline driving the sale (1031 exchange, divorce, estate, relocation)? That informs how much negotiation room exists.
- Schools are D-rated, which usually means shorter tenancies and higher turnover. Who's the typical renter profile here, and what's been the actual vacancy rate?
- Crime grade is F in this area — have there been break-ins, vandalism, or insurance claims at this property in the last 3 years? What carrier currently insures it and at what premium?
- The area grade is low — what's the realistic commute time and amenity access for the typical tenant pool here? Any planned neighborhood developments (good or bad) we should know about?
- What's the average days-on-market for RENTAL listings here right now (not sales)? A rising rental-DOM trend means longer vacancies and softer asking-rent achievability than the comps imply.
- What's the recent tenant-quality profile in this submarket — average credit score on applications, eviction rate, late-payment / NSF rate, and stable-employment percentage? A property-management company in the area should have these aggregated.
- How much new for-sale + rental construction is in the pipeline within 1–3 miles? Heavy new supply typically softens prices + rents 12–24 months out; constrained supply supports both.
CashFlowRE · CFR-8MHXAED3BJA1WQ
· Data 1 day ago
cashflowre.app · 2026-05-29