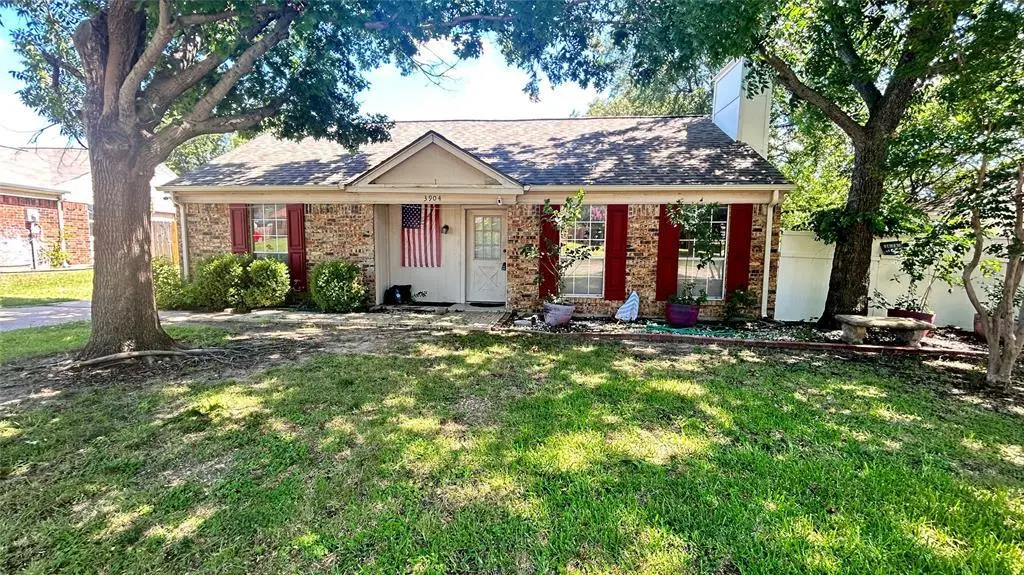
3904 Manzinita St · Fort Worth, TX
Flood risk 1/10 · Minimal
- FEMA flood zone
- X (unshaded)
- Chance of flooding over 30 yrs
- 0.0%
- Est. flood insurance / yr
- $507 – $1,088
Fire risk 3/10 · Minor
- Est. fire insurance / yr
- $1,222 – $2,270
Heat risk 7/10 · Major
- Hot days now (above 109°F)
- 7 days/yr
- Hot days in 30 yrs
- 23 days/yr
Wind risk 4/10 · Minor
- Chance of severe wind over 30 yrs
- 19.0%
Air-quality risk 4/10 · Minor
- Unhealthy air days now
- 4 days/yr
- Unhealthy air days in 30 yrs
- 5 days/yr
Risk factors via First Street. Map © Google.
Why this score? — see what drove the D+ grade
The composite is a weighted blend of 9 inputs, each scored 0–100. Each bar is that input's sub-score; the figure is the points it added to the 100-point composite (weight × sub-score).
- ARV discount +14.9/15.0
- Cash flow +12.5/30.0
- Schools +4.8/10.0
- 1% rule +4.5/10.0
- Livability +4.0/5.0
- DSCR +3.7/10.0
- Condition / age +2.5/5.0
- Rent growth +2.2/5.0
- Appreciation +0.0/10.0
$199,900
🖨 Deal sheet (PDF) 📄 Offer letter ✓ Due diligence
Listing remarks
Investor special, first-time buyer opportunity, or perfect rental property in Keller ISD! Priced aggressively under $200,000, this 2-bedroom, 1-bath home offers incredible value with major updates already completed, including the roof, HVAC, and electrical system in 2021. The interior is clean and move-in ready, while still offering the opportunity to add your own cosmetic touches and build instant equity. Conveniently located with easy access to shopping, dining, and major highways, this is a rare chance to own an affordable home in Keller ISD. Don't miss this opportunity—schedule your showing today!
Key facts
- Move-in ready
- Easy access
- Major updates
Tags
Property features AI
Finance
- Other: Municipal utility district: No
- Financial info: Treat as clear loan type; No second mortgage reported
- HOA & community: No association
Exterior
- Parking: Driveway (no garage, no covered or carport spaces)
- Utilities: City water; City sewer; Cable available
- Home design: Single-family residence; Residential property; One story; Preowned (built in 1983); Not attached to another property; Does not have accessibility features
- Construction: Built in 1983
- Exterior features: Lot under 0.5 acre (approximately 0.162 acres); Subdivision: Summerfields Addition; Follow GPS for directions
Interior
- Kitchen: Dishwasher; Electric cooktop; Electric oven
- Bedrooms: 2 bedrooms (primary bedroom on level 1)
- Bathrooms: 1 full bathroom
- Heating & cooling: No smart-home heating/cooling features reported
- Interior features: Cable TV available; High-speed internet available; One living area; One dining area; 2 total rooms
Neighborhood map
What this means for you Summary
Snapshot
- This is a 3-bed/2.0-bath single-family listed at $200k.
Deal economics
- At list price, monthly cash flow is $-30 ($-356/yr) — negative.
- To cash-flow at today's rent, offer at most $195k (2.6% below list).
- To meet the 1% rule (rent ≥ 1% of price), the offer needs to be $190k (5.2% below list).
- Recommended offer: $190k (5.2% below list) — sets the bar for 1% rule.
- Cap rate 6.1% vs local median 3.9% in Fort Worth — top-decile yield for the area; either an underpriced asset or a hidden risk that comps aren't pricing in. Stress-test before assuming the spread holds.
Location & tenants
- Location reads 80/100 on livability (#49 in TX, #1,954 nationally) — a professional / high-income tenant draw. Strengths: amenities A+, cost of living A+, housing A+; Watch: crime F.
- Keller ISD (urban): math 50% / reading 54% proficiency, ranked #91 of 826 in TX (top 11%) — acceptable for families but not a draw, mixed tenant base, ~2y average lease; only 19% free/reduced lunch — higher-income household profile.
- Zoned schools: North Riverside El (math 25% / reading 33%, grade F, #2,668 of 4,322 statewide, top 63%, 488 students, 70% FRL); Fossil Hill Middle (math 32% / reading 43%, grade F, #736 of 1,662 statewide, top 45%, 838 students, 61% FRL); Fossil Ridge H S (math 41% / reading 55%, grade D, #571 of 1,632 statewide, top 36%, 2,329 students, 51% FRL) — zoned schools average 60% FRL vs 19% district-wide (42 pts higher); higher-poverty schools than district average — tighter screening recommended.
- Zoned-school proficiency averages 38% at this address vs 52% district-wide (-14 pts) — the specific schools serving this property underperform the Keller ISD average; the district grade overstates school quality for this exact location.
- Market conditions: Rents soft (-1.4%/yr); 212 active listings in the ZIP; 40 comparable units currently listed for rent nearby; rentals at typical pace (median 15d on market — plan ~3-4 weeks tenant-placement turnaround); solid renter incomes; 18,938 units permitted in Tarrant County in 2024 (8,336 in 5+ unit buildings).
Forward outlook
- Local home prices are declining (-3.0%/yr); year-one equity from $1k of loan paydown is wiped out by about $6k of value loss. Plan a longer hold.
- Tarrant County population projected at +41% by 2050 — long-run rental-demand tailwind backs the buy-and-hold thesis.
Negotiation context
- Only 3 days on market — expect competitive offers; lowballing is unlikely to land.
Risks & watch-outs
- Climate carrying-cost: extreme-heat days projected 7→23/yr by 2055 (HVAC capex compounding) — expect insurance premiums to compound above CPI over the hold.
Questions for the listing agent
- What do current leases actually rent for vs. the listed asking? Can we see a recent rent roll and the last 12 months of T-12 income?
- Is there a deadline driving the sale (1031 exchange, divorce, estate, relocation)? That informs how much negotiation room exists.
- Schools are D-rated, which usually means shorter tenancies and higher turnover. Who's the typical renter profile here, and what's been the actual vacancy rate?
- Crime grade is F in this area — have there been break-ins, vandalism, or insurance claims at this property in the last 3 years? What carrier currently insures it and at what premium?
- The area grade is low — what's the realistic commute time and amenity access for the typical tenant pool here? Any planned neighborhood developments (good or bad) we should know about?
- What's the average days-on-market for RENTAL listings here right now (not sales)? A rising rental-DOM trend means longer vacancies and softer asking-rent achievability than the comps imply.
- What's the recent tenant-quality profile in this submarket — average credit score on applications, eviction rate, late-payment / NSF rate, and stable-employment percentage? A property-management company in the area should have these aggregated.
- How much new for-sale + rental construction is in the pipeline within 1–3 miles? Heavy new supply typically softens prices + rents 12–24 months out; constrained supply supports both.
Investment metrics
- 1% rule
- 0.95% ✗
- Cap rate
- 6.11%
- Cash-on-cash
- -0.64%
- DSCR
- 0.97
- GRM
- 8.8
CMA / ARV
- ARV (on-the-fly)
- $239,148
- Comps found
- 12
Show comp detail 12 sales within ~0.75 mi
| Address | Dist | Beds/Ba | Sqft | Sold | Price | $/sf | Match |
|---|---|---|---|---|---|---|---|
| 7028 Shadow Bend Dr | 0.36mi | 3/1.5 | 1,026 (+0%) | 9mo | $240,000 | $234 | 73 |
| 7229 Buttonwood Dr | 0.23mi | 3/1.5 | 1,054 (+3%) | 13mo | $219,900 | $209 | 71 |
| 3812 Staghorn Cir S | 0.21mi | 3/2.0 | 1,104 (+8%) | 8mo | $300,000 | $272 | 70 |
| 7045 Shadow Bend Dr | 0.36mi | 2/1.0 (-1) | 1,022 (0%) | 8mo | $234,900 | $230 | 68 |
| 7013 Buttonwood Dr | 0.43mi | 2/1.0 (-1) | 1,022 (0%) | 7mo | $239,000 | $234 | 65 |
| 4017 Huckleberry Dr | 0.43mi | 3/2.0 | 1,115 (+9%) | 4mo | $275,000 | $247 | 62 |
| 3920 Dogwood Ln | 0.38mi | 3/2.0 | 1,106 (+8%) | 12mo | $275,000 | $249 | 58 |
| 4141 Spindletree Ln | 0.33mi | 2/1.0 (-1) | 1,067 (+4%) | 14mo | $234,999 | $220 | 57 |
| 7801 Waxwing Cir W | 0.56mi | 2/1.0 (-1) | 1,033 (+1%) | 10mo | $247,500 | $240 | 55 |
| 7313 Sunnybank Dr | 0.71mi | 3/1.0 | 1,061 (+4%) | 15mo | $187,500 | $177 | 44 |
| 4400 Park Creek Ct | 0.67mi | 3/2.0 | 1,135 (+11%) | 11mo | $255,000 | $225 | 42 |
| 4645 Greenfern Ln | 0.74mi | 2/1.0 (-1) | 1,094 (+7%) | 14mo | $230,990 | $211 | 33 |
Match score weights: distance 35% · size 25% · config 20% · recency 20%. Top-matched comps best support the ARV.
Projected returns pro-forma
-3.0% appreciation · 0.0% rent growth · sell at horizon
- IRR
- -21.1%
- Equity multiple
- 0.29×
- Total profit
- $-39,719
- Equity at exit
- $29,806
- IRR
- -24.9%
- Equity multiple
- -0.04×
- Total profit
- $-58,007
- Equity at exit
- $17,284
Cash invested: $55,972 (down + closing). Projections, not guarantees.
Landlord ↔ Tenant lean methodology
- Overall (STATE)
- 87 Strongly Landlord-Friendly
- State Texas
- 87 Strongly Landlord-Friendly · R+5
- County
- — inherits STATE
- City
- — inherits STATE
ZIP-level market 76137
- Home prices YoY
- -28.8%
- Rents YoY
- -1.4%
- Active inventory
- 212
- Price-to-rent
- 8.8×
Monthly cashflow live
- Estimated rent
- $1,895 high interval (Pro) →
- Mortgage (P&I)
- −$1,048
- Tax from tax record
- −$395 /mo · $4,746/yr
- Insurance
- −$83
- HOA
- −$0
- Vacancy / Maint / Mgmt
- −$398
- Net cashflow
- $-30
Break-even live
Sensitivity live
| Price | -10% $83 | -5% $27 | +0% $-30 | +5% $-86 | +10% $-143 |
|---|---|---|---|---|---|
| Rent | -10% $-179 | -5% $-105 | +0% $-30 | +5% $45 | +10% $120 |
| Rate | -1.0pp $71 | -0.5pp $21 | base $-30 | +0.5pp $-81 | +1.0pp $-134 |
UW: 25.0% down · 7.5% · 30yr · 1.5% tax · 5.0% vac · 8.0% maint · 8.0% mgmt
Financing live
Cash to close
- Down payment
- $49,975
- Closing costs
- $5,997
- Reserves months
- —
- Total cash needed
- —
Loan-product check · same deal, 3 products live
Conventional
25% down · 7.5% · 30yr
- Down + closing
- —
- Monthly P&I
- —
- Monthly cashflow
- —
- DSCR
- —
- Eligible?
- —
Personal DTI + credit; lowest rate.
DSCR
20% down · 8.5% · 30yr
- Down + closing
- —
- Monthly P&I
- —
- Monthly cashflow
- —
- DSCR
- —
- Eligible?
- —
No personal income docs; deal must DSCR.
Hard money
10% down · 12.0% · 12mo
- Down + closing
- —
- Monthly P&I
- —
- Monthly cashflow
- —
- DSCR
- —
- Eligible?
- —
Short-term bridge; refi at stabilization.
Rent comps 40 comps
| Address | Beds | Baths | Sqft | Rent | $/sqft | DOM | Units | Dist |
|---|---|---|---|---|---|---|---|---|
| 3728 Flintwood Trl Fort Worth, TX | 2.0 | 1.0 | 1048 | $1,850 | $1.77 | 6d | 1 | 0.22mi |
| 4208 Staghorn Cir S Fort Worth, TX | 3.0 | 2.0 | 1470 | $2,075 | $1.41 | 9d | 1 | 0.23mi |
| 7305 Shadow Bend Dr Fort Worth, TX | 3.0 | 2.0 | 1362 | $1,870 | $1.37 | 45d | 1 | 0.24mi |
| 3728 Staghorn Cir S Fort Worth, TX | 3.0 | 2.0 | 1104 | $1,700 | $1.54 | 6d | 1 | 0.26mi |
| 7204 Shadow Bend Dr Fort Worth, TX | 3.0 | 2.0 | 1013 | $1,940 | $1.92 | 45d | 1 | 0.30mi |
| 7204 Shadow Bend Dr Fort Worth, TX | 3.0 | 2.0 | 1013 | $1,650 | $1.63 | 16d | 1 | 0.30mi |
| 4113 Pepperbush Dr Fort Worth, TX | 3.0 | 2.0 | 1162 | $1,795 | $1.54 | 6d | 1 | 0.35mi |
| 4020 Blue Flag Ln Fort Worth, TX | 3.0 | 2.0 | 1454 | $2,025 | $1.39 | 17d | 1 | 0.36mi |
| 7116 Wayfarer Trl Fort Worth, TX | 3.0 | 2.0 | 1295 | $1,796 | $1.39 | 20d | 1 | 0.37mi |
| 3737 Whitefern Dr Fort Worth, TX | 3.0 | 2.0 | 1435 | $1,995 | $1.39 | 1d | 1 | 0.38mi |
| 3728 Chaddybrook Ln Fort Worth, TX | 3.0 | 2.0 | 1328 | $1,900 | $1.43 | 6d | 1 | 0.39mi |
| 3725 Whitefern Dr Fort Worth, TX | 3.0 | 2.5 | 1425 | $1,985 | $1.39 | 6d | 1 | 0.40mi |
| 3600 Basswood Blvd Unit 3627 Fort Worth, TX | 2.0 | 2.0 | 1134 | $1,468 | $1.29 | 1d | 1 | 0.42mi |
| 3600 Basswood Blvd Unit 3637 Fort Worth, TX | 2.0 | 2.0 | 1134 | $1,640 | $1.45 | 45d | 1 | 0.42mi |
| 3600 Basswood Blvd Unit 3633 Fort Worth, TX | 3.0 | 2.0 | 1417 | $1,868 | $1.32 | 1d | 1 | 0.42mi |
| 7009 Shadow Bend Dr Fort Worth, TX | 3.0 | 2.0 | 1044 | $1,900 | $1.82 | 17d | 1 | 0.43mi |
| 3913 Periwinkle Dr Fort Worth, TX | 3.0 | 2.0 | 1452 | $2,000 | $1.38 | 9d | 1 | 0.52mi |
| 6929 Egan Way Fort Worth, TX | 3.0 | 2.0 | 1454 | $2,090 | $1.44 | 1d | 1 | 0.52mi |
| 4001 Periwinkle Dr Fort Worth, TX | 3.0 | 2.0 | 1314 | $2,020 | $1.54 | 1d | 1 | 0.53mi |
| 4208 Staghorn Cir N Fort Worth, TX | 3.0 | 2.0 | 1470 | $2,075 | $1.41 | 9d | 1 | 0.56mi |
| 4021 Staghorn Cir N Fort Worth, TX | 3.0 | 2.0 | 1450 | $2,245 | $1.55 | 45d | 1 | 0.58mi |
| 7000 N Beach St Unit 7037 Fort Worth, TX | 2.0 | 2.0 | 1050 | $1,684 | $1.60 | 45d | 1 | 0.67mi |
| 7000 N Beach St Unit 7023 Fort Worth, TX | 2.0 | 2.0 | 1050 | $1,733 | $1.65 | 1d | 1 | 0.67mi |
| 7000 N Beach St Unit 7057 Fort Worth, TX | 2.0 | 2.0 | 879 | $1,504 | $1.71 | 14d | 1 | 0.67mi |
| 7000 N Beach St Unit 7037 Fort Worth, TX | 2.0 | 2.0 | 879 | $1,504 | $1.71 | 16d | 1 | 0.67mi |
| 3945 Spoonwood Ln Fort Worth, TX | 3.0 | 2.0 | 1457 | $2,000 | $1.37 | 1d | 1 | 0.68mi |
| 7000 N Beach St Fort Worth, TX | 2.0 | 2.0 | 971 | $1,659 | $1.71 | 45d | 1 | 0.70mi |
| 4653 Feathercrest Dr Fort Worth, TX | 3.0 | 2.0 | 1272 | $1,925 | $1.51 | 20d | 1 | 0.74mi |
| 6901 N Beach St Fort Worth, TX | 1.0–3.0 | 1.0–2.0 | 855 | $1,596 | $1.87 | 45d | 1 | 0.75mi |
| 4621 Riverpark Dr Fort Worth, TX | 3.0 | 2.0 | 1238 | $1,800 | $1.45 | 12d | 1 | 0.77mi |
| 4648 Birchbend Ln Fort Worth, TX | 3.0 | 2.0 | 1322 | $1,850 | $1.40 | 24d | 1 | 0.77mi |
| 4241 Iris Ave Fort Worth, TX | 3.0 | 2.0 | 1421 | $1,975 | $1.39 | 26d | 1 | 0.82mi |
| 6960 N Beach St Fort Worth, TX | 1.0–3.0 | 1.0–2.0 | 908 | $1,929 | $2.12 | 1d | 29 | 0.84mi |
| 4205 Fernleaf Dr Fort Worth, TX | 3.0 | 2.0 | 1385 | $2,130 | $1.54 | 45d | 1 | 0.84mi |
| 4621 Rose of Sharon Ln Fort Worth, TX | 3.0 | 2.0 | 1118 | $1,800 | $1.61 | 19d | 1 | 0.91mi |
| 8112 Broken Arrow Rd Fort Worth, TX | 3.0 | 2.0 | 1441 | $1,815 | $1.26 | 13d | 1 | 0.93mi |
| 8060 Cannonwood Dr Fort Worth, TX | 3.0 | 2.0 | 1471 | $1,950 | $1.33 | 45d | 1 | 0.96mi |
| 4741 Birchbend Ln Fort Worth, TX | 3.0 | 2.0 | 1313 | $1,850 | $1.41 | 16d | 1 | 0.97mi |
| 4741 Birchbend Ln Fort Worth, TX | 3.0 | 2.0 | 1313 | $1,850 | $1.41 | 1d | 1 | 0.97mi |
| 6761 Sandshell Blvd Fort Worth, TX | 1.0–3.0 | 1.0–2.0 | 1099 | $2,640 | $2.40 | 4d | 24 | 1.02mi |
Listing history 3 events
-
2026-06-21days on market $199,900 Active 3 DOM
-
2026-06-18remarks 608-char remark
-
2026-06-18$199,900 Active 1 DOM
ⓘ Source: listings_history table (triggers on properties + properties_extension) + one-shot
backfill from property_details.listing_events for pre-trigger history.
Tax reassessment forecast TX · Resets to sale price
- Current annual tax
- $4,746 · $395/mo
- Projected year-2 tax
- $4,746 · $395/mo
- Expected delta
- $0/yr ($0/mo · 0.0%)
ⓘ Screening estimate from a state-policy table — verify with the county assessor before closing.
Climate risk First Street
- Flood 1/10 Low FEMA zone X (unshaded) · 0% chance over 30 yrs
- Wildfire 3/10 Moderate
- Heat 7/10 Severe 7 d/yr ≥109°F today · 23 d/yr by 30 yrs out
- Wind 4/10 Moderate 19% chance of damaging wind over 30 yrs
- Air quality 4/10 Moderate 4 unhealthy d/yr today · 5 by 30 yrs out
Nearby sold comps map
Loading sold comps map…
Walkable amenities ~0.75 mi
Loading nearby amenities…
Taxation est. · year 1
- Rental income
- $22,746
- − Mortgage interest
- −$11,198
- − Property taxes
- −$4,746
- − Insurance
- −$1,000
- − Repairs & maintenance
- −$1,820
- − Management
- −$1,820
- − Depreciation
- −$5,815
- Taxable loss
- −$3,652
- Est. tax savings @ 24.0%
- +$876
- After-tax cash flow
- $520/yr
For passive investors: Depreciation is non-cash, so a rental often shows a tax loss while cash-flowing — sheltering income. Rental losses are passive: they offset passive income freely, and up to $25,000/yr can offset ordinary (W-2) income if you actively participate and your MAGI is under $100k (phasing out to $0 by $150k); unused losses carry forward. On sale, claimed depreciation is recaptured at up to 25%, and gains may owe capital-gains tax (a 1031 exchange can defer both). Figures are a year-1 estimate at your 24.0% rate — not tax advice; consult a CPA.
Schools (NCES district)
- District
- Keller ISD
- NCES district ID
- 4825260
- Math proficiency
- 50% ▼ -14.00%
- Reading proficiency
- 54% ▼ -9.00%
- Median HH income
- $92,106
- Composite
- 48.46/100
- National rank
- #2131
- State rank
- #91 of 826 in TX
Livability — Fort Worth
- Score
- 80/100
- State rank
- #49
- US rank
- #1954
Category grades
Schools grade is shown separately in the Schools card above.
Census & demographics
- Census place
- Fort Worth, TX
- County
- Tarrant County · 2,033,669 people
- City population
- 911,619
- Metro
- Dallas-Fort Worth-Arlington, TX
- Population (ZIP)
- 60,352
- Household income
- $90,718
- Rent vs Own
- Severe rent burden
- 1857.0
Population outlook (Tarrant County) Hauer SSP2
- Today (2025)
- 2,380,417 people
- By 2030
- 2,578,900 · +8.3%
- By 2040
- 2,974,995 · +25.0%
- By 2050
- 3,350,489 · +40.8%
- By 2075
- 4,216,909 · +77.2%
- By 2100
- 4,741,527 · +99.2%
Race, ethnicity, and origin ACS 2023
- Neighborhood character
- Highly diverse neighborhood (Simpson 0.70)
- Race & ethnicity
- White 46% Hispanic / Latino 24% Black 15% Two or more races 13% Asian 10%
- Hispanic origin (detail)
- Mexican 18% Puerto Rican 1%
- Common ancestry
- Italian 2% Lithuanian 1% Slovak 1%
- Foreign-born
- 16% · Canada, Vietnam, South Korea
- Languages at home
- 74% English-only · Spanish 15% Other Indo-European 4% Vietnamese 2%
Political lean MEDSL · Tarrant
- 2024 margin
- Lean R (+5.1) · D 46.7% · R 51.9% · Other 1.4%
- 2008→2024 swing
- +6.6pp toward D · 2008: -11.7pp · 2024: -5.1pp
- All cycles
- 2024: R+5.1 2020: D+0.2 2016: R+8.7 2012: R+15.7 2008: R+11.7
Not yet ingested
- Civics
- —
Market trends
- HPI YoY
- ▼ -108.62%
- Current HPI
- 268.8753
- Rent YoY
- ▼ -1.37%
- Metro
- Dallas-Fort Worth-Arlington, TX
- State GDP YoY
- ▲ 3.95%
- F500 in state
- 110
Industry mix (Fortune 500 HQ in TX)
| Industry | F500 HQs | Revenue |
|---|---|---|
| Energy | 16 | $1,198B |
|
||
| Technology | 5 | $198B |
|
||
| Engineering / Construction | 4 | $72B |
|
||
| Energy Services | 3 | $60B |
|
||
| Utilities | 3 | $41B |
|
||
| Healthcare | 2 | $330B |
|
||
Price history
4 events — show timeline
- 2026-06-18 Listed $199,900 NTREIS
- 1998-12-31 Sold (Public Records) — Public Records
- 1998-10-07 Sold (Public Records) — Public Records
- 1995-02-03 Sold (Public Records) — Public Records
Property tax history
+6.3%/yrLatest (2025): $4,746 · +8.0% YoY. Source: county tax records.
Cash-flow waterfall
monthlySold comps — $/sqft
last 12 mo · ≤1 miLoading sold comps…