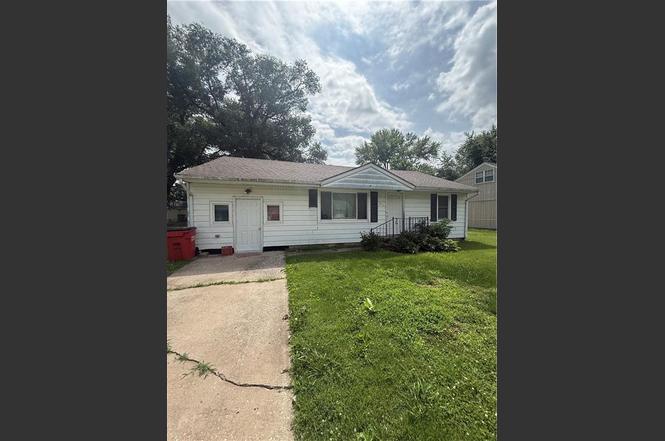
311 N Hudson St
Buckner, MO 64016
$75,000B-
2 bd · 1.0 ba ·
1,092 sqft ·
Built 1954
· SingleFamily
· Pending
· 1 DOM
Cashflow @ list (25.0% down · 7.5%)
Estimated rent
$1,611/mo
Mortgage (P&I)
−$393
Tax + insurance
−$583
HOA
−$0
Vac / Maint / Mgmt
−$338
Net cashflow
$296/mo
Annual
$3,551/yr
Cap rate
17.85%
Cash-on-cash
41.28%
DSCR
2.84
1% rule
2.15%
Cash to close
$21,000
Investor read
- This is a 2-bed/1.0-bath single-family listed at $75k.
- At list price, monthly cash flow is $296 ($4k/yr) — positive.
- The deal already cash-flows at list — no discount required.
- Meets the 1% rule at list price ($2k rent vs $75k).
- Only 1 days on market — expect competitive offers; lowballing is unlikely to land.
- Local home prices are declining (-3.0%/yr); year-one equity from $519 of loan paydown is wiped out by about $2k of value loss. Plan a longer hold.
- Location reads 70/100 on livability (#134 in MO) — a middle-class / working-renter tenant base. Strengths: cost of living A+, housing A+, health & safety B+; Watch: amenities F, commute F.
- Fort Osage R-I (rural): math 28% / reading 39% proficiency, ranked #213 of 324 in MO (top 66%) — families likely to look elsewhere, expect single-tenant / working-renter base with shorter leases.
- Zoned schools: Buckner Elem. (math 42% / reading 47%, grade F, #413 of 1,115 statewide, top 42%, 334 students, 45% FRL); Osage Trail Middle (math 21% / reading 42%, grade F, #276 of 391 statewide, top 71%, 793 students, 46% FRL); Fort Osage High (math 33% / reading 48%, grade F, #240 of 521 statewide, top 46%, 1,557 students, 39% FRL) — zoned schools at 43% FRL track the district average.
- Watch-outs: flood insurance adds $427/mo; built in 1954 — expect roof / HVAC / electrical / plumbing capex.
- Market conditions: 33 active listings in the ZIP; 2 comparable units currently listed for rent nearby; 4,002 units permitted in Jackson County in 2024 (2,271 in 5+ unit buildings).
- Jackson County population projected at +4% by 2050 — modest demand growth; plan on rents tracking national, not racing it.
- 3 sale attempts since 26y ago with the ask held roughly flat each time — persistent listings suggest the price (not the market) is what's stuck; bring a comps-based counter.
- At projected returns (-3.0% appreciation + 3.0% rent growth), your $21k cash investment doubles in ~7 years — after that, you're playing with house money.
- Climate carrying-cost: in FEMA flood zone AE (mandatory federal flood insurance) — expect insurance premiums to compound above CPI over the hold.
Questions for listing agent
- Built in 1954 — when were the roof, HVAC, electrical panel, plumbing, and water heater last replaced?
- What's the actual annual flood-insurance premium (NFIP or private), and is the property in a SFHA with mandatory coverage?
- Is there a deadline driving the sale (1031 exchange, divorce, estate, relocation)? That informs how much negotiation room exists.
- Schools are F-rated, which usually means shorter tenancies and higher turnover. Who's the typical renter profile here, and what's been the actual vacancy rate?
- What's the average days-on-market for RENTAL listings here right now (not sales)? A rising rental-DOM trend means longer vacancies and softer asking-rent achievability than the comps imply.
- What's the recent tenant-quality profile in this submarket — average credit score on applications, eviction rate, late-payment / NSF rate, and stable-employment percentage? A property-management company in the area should have these aggregated.
- How much new for-sale + rental construction is in the pipeline within 1–3 miles? Heavy new supply typically softens prices + rents 12–24 months out; constrained supply supports both.
CashFlowRE · CFR-8MX8YM70KRJ1KZ
· Data 4 days ago
cashflowre.app · 2026-05-29