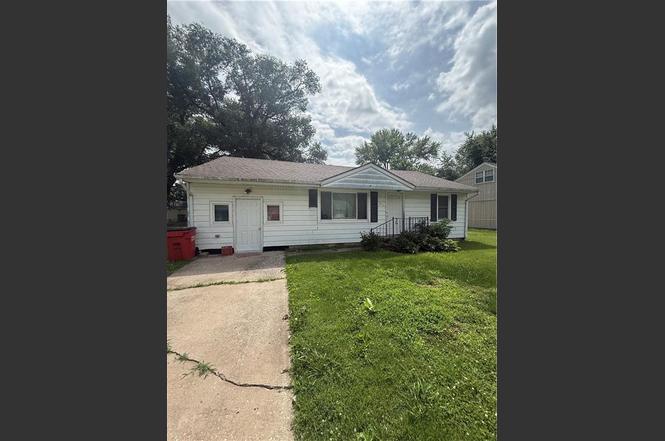
311 N Hudson St · Buckner, MO
Flood risk 1/10 · Minimal
- FEMA flood zone
- AE
- Chance of flooding over 30 yrs
- 0.0%
- Est. flood insurance / yr
- $1,737 – $8,500
Fire risk 1/10 · Minimal
- Est. fire insurance / yr
- $1,054 – $1,958
Heat risk 4/10 · Minor
- Hot days now (above 107°F)
- 7 days/yr
- Hot days in 30 yrs
- 16 days/yr
Wind risk 2/10 · Minimal
- Chance of severe wind over 30 yrs
- —
Air-quality risk 4/10 · Minor
- Unhealthy air days now
- 4 days/yr
- Unhealthy air days in 30 yrs
- 5 days/yr
Risk factors via First Street. Map © Google.
Why this score? — see what drove the B- grade
The composite is a weighted blend of 9 inputs, each scored 0–100. Each bar is that input's sub-score; the figure is the points it added to the 100-point composite (weight × sub-score).
- Cash flow +30.0/30.0
- 1% rule +10.0/10.0
- DSCR +10.0/10.0
- ARV discount +7.5/15.0
- Livability +3.5/5.0
- Schools +3.0/10.0
- Rent growth +2.5/5.0
- Condition / age +2.5/5.0
- Appreciation +0.0/10.0
$75,000
🖨 Deal sheet (PDF) 📄 Offer letter ✓ Due diligence
Listing remarks MLS
NEED A QUICK SALE! Bargain Priced! Adorable ranch home. Low Utility bills! New energy efficient thermal windows, & HWH in '04. New furnace & A/C '05. Steel Siding. Security System. Wood Floors under carpet. Fenced yard! Fort Osage Schools. Would be a good first home or rental. Seller's Disclosure
Key facts
- 8,712 sq ft lot
- Garage
- Built 1954
Property features AI
Finance
- Other: Above grade finished area reported as 1,092 (public records)
- HOA & community: No association fees; No maintenance provided
Exterior
- Parking: Converted garage
- Security: Security system; Smoke detectors
- Utilities: Public water; Public sewer; Metro Free telecom
- Home design: Single family residence; Residential property; Ranch style; One-story (living spaces on first floor); In a flood plain
- Construction: Vinyl siding; Composition roof
- Exterior features: Metal fencing; City lot; Lot approximately 75 x 100
Interior
- Kitchen: Microwave; Refrigerator; Gas range
- Bedrooms: 2 bedrooms (both on the first floor)
- Flooring: Carpet
- Bathrooms: 1 full bathroom with linoleum and separate shower and tub (first floor)
- Heating & cooling: Forced air heating; Electric cooling (has cooling)
- Interior features: Thermal windows; Eat-in kitchen; Family room on garage level; Ranch floor plan
- Laundry & utility: Laundry area located in the garage
Neighborhood map
What this means for you Summary
Snapshot
- This is a 2-bed/1.0-bath single-family listed at $75k.
Deal economics
- At list price, monthly cash flow is $296 ($4k/yr) — positive.
- The deal already cash-flows at list — no discount required.
- Meets the 1% rule at list price ($2k rent vs $75k).
Location & tenants
- Location reads 70/100 on livability (#134 in MO) — a middle-class / working-renter tenant base. Strengths: cost of living A+, housing A+, health & safety B+; Watch: amenities F, commute F.
- Fort Osage R-I (rural): math 28% / reading 39% proficiency, ranked #213 of 324 in MO (top 66%) — families likely to look elsewhere, expect single-tenant / working-renter base with shorter leases.
- Zoned schools: Buckner Elem. (math 42% / reading 47%, grade F, #413 of 1,115 statewide, top 42%, 334 students, 45% FRL); Osage Trail Middle (math 21% / reading 42%, grade F, #276 of 391 statewide, top 71%, 793 students, 46% FRL); Fort Osage High (math 33% / reading 48%, grade F, #240 of 521 statewide, top 46%, 1,557 students, 39% FRL) — zoned schools at 43% FRL track the district average.
- Market conditions: 33 active listings in the ZIP; 2 comparable units currently listed for rent nearby; 4,002 units permitted in Jackson County in 2024 (2,271 in 5+ unit buildings).
Forward outlook
- Local home prices are declining (-3.0%/yr); year-one equity from $519 of loan paydown is wiped out by about $2k of value loss. Plan a longer hold.
- Jackson County population projected at +4% by 2050 — modest demand growth; plan on rents tracking national, not racing it.
- At projected returns (-3.0% appreciation + 3.0% rent growth), your $21k cash investment doubles in ~7 years — after that, you're playing with house money.
Negotiation context
- Only 1 days on market — expect competitive offers; lowballing is unlikely to land.
- 3 sale attempts since 26y ago with the ask held roughly flat each time — persistent listings suggest the price (not the market) is what's stuck; bring a comps-based counter.
Risks & watch-outs
- Watch-outs: flood insurance adds $427/mo; built in 1954 — expect roof / HVAC / electrical / plumbing capex.
- Climate carrying-cost: in FEMA flood zone AE (mandatory federal flood insurance) — expect insurance premiums to compound above CPI over the hold.
Questions for the listing agent
- Built in 1954 — when were the roof, HVAC, electrical panel, plumbing, and water heater last replaced?
- What's the actual annual flood-insurance premium (NFIP or private), and is the property in a SFHA with mandatory coverage?
- Is there a deadline driving the sale (1031 exchange, divorce, estate, relocation)? That informs how much negotiation room exists.
- Schools are F-rated, which usually means shorter tenancies and higher turnover. Who's the typical renter profile here, and what's been the actual vacancy rate?
- What's the average days-on-market for RENTAL listings here right now (not sales)? A rising rental-DOM trend means longer vacancies and softer asking-rent achievability than the comps imply.
- What's the recent tenant-quality profile in this submarket — average credit score on applications, eviction rate, late-payment / NSF rate, and stable-employment percentage? A property-management company in the area should have these aggregated.
- How much new for-sale + rental construction is in the pipeline within 1–3 miles? Heavy new supply typically softens prices + rents 12–24 months out; constrained supply supports both.
Investment metrics
- 1% rule
- 2.15% ✓
- Cap rate
- 17.85%
- Cash-on-cash
- 41.28%
- DSCR
- 2.84
- GRM
- 3.9
CMA / ARV
- ARV (on-the-fly)
- $204,204
- Comps found
- 11
Show comp detail 11 sales within ~0.75 mi
| Address | Dist | Beds/Ba | Sqft | Sold | Price | $/sf | Match |
|---|---|---|---|---|---|---|---|
| 314 Prairie St | 0.03mi | 2/1.0 | 1,112 (+2%) | 24mo | $142,000 | $128 | 76 |
| 8 Bart St | 0.08mi | 3/1.0 (+1) | 1,000 (-8%) | 7mo | $184,000 | $184 | 72 |
| 209 N Hudson Rd | 0.08mi | 3/1.5 (+1) | 1,155 (+6%) | 12mo | $249,900 | $216 | 69 |
| 20 Johnson St | 0.31mi | 3/1.0 (+1) | 1,152 (+6%) | 3mo | $90,000 | $78 | 69 |
| 301 N Hudson St | 0.06mi | 3/1.5 (+1) | 936 (-14%) | 5mo | $175,000 | $187 | 63 |
| 118 Park Ave | 0.16mi | 3/1.0 (+1) | 950 (-13%) | 8mo | $207,500 | $218 | 59 |
| 106 Cliff Dr | 0.39mi | 3/1.0 (+1) | 1,000 (-8%) | 10mo | $185,000 | $185 | 54 |
| 301 N Prairie St | 0.06mi | 3/1.0 (+1) | 1,250 (+14%) | 20mo | $159,900 | $128 | 52 |
| 206 E Jefferson St | 0.57mi | 3/2.0 (+1) | 1,122 (+3%) | 18mo | $249,500 | $222 | 45 |
| 300 E Jefferson St | 0.58mi | 3/1.5 (+1) | 1,200 (+10%) | 7mo | $242,500 | $202 | 43 |
| 200 E Jefferson St | 0.55mi | 3/2.0 (+1) | 1,220 (+12%) | 22mo | $264,900 | $217 | 27 |
Match score weights: distance 35% · size 25% · config 20% · recency 20%. Top-matched comps best support the ARV.
Projected returns pro-forma
-3.0% appreciation · 3.0% rent growth · sell at horizon
- IRR
- 8.5%
- Equity multiple
- 1.33×
- Total profit
- $7,000
- Equity at exit
- $11,183
- IRR
- 17.9%
- Equity multiple
- 2.51×
- Total profit
- $31,607
- Equity at exit
- $6,485
Cash invested: $21,000 (down + closing). Projections, not guarantees.
Landlord ↔ Tenant lean methodology
- Overall (STATE)
- 81 Strongly Landlord-Friendly
- State Missouri
- 81 Strongly Landlord-Friendly · R+10
- County
- — inherits STATE
- City
- — inherits STATE
ZIP-level market 64016
- Home prices YoY
- -29.3%
- Active inventory
- 33
- Price-to-rent
- 3.9×
Monthly cashflow live
- Estimated rent
- $1,611 medium interval (Pro) →
- Mortgage (P&I)
- −$393
- Tax from tax record
- −$126 /mo · $1,507/yr
- Insurance
- −$31
- Flood insurance flood zone
- −$427 /mo · $5,118/yr
- HOA
- −$0
- Vacancy / Maint / Mgmt
- −$338
- Net cashflow
- $296
Break-even live
Sensitivity live
| Price | -10% $338 | -5% $317 | +0% $296 | +5% $275 | +10% $253 |
|---|---|---|---|---|---|
| Rent | -10% $169 | -5% $232 | +0% $296 | +5% $360 | +10% $423 |
| Rate | -1.0pp $334 | -0.5pp $315 | base $296 | +0.5pp $276 | +1.0pp $257 |
UW: 25.0% down · 7.5% · 30yr · 1.5% tax · 5.0% vac · 8.0% maint · 8.0% mgmt
Financing live
Cash to close
- Down payment
- $18,750
- Closing costs
- $2,250
- Reserves months
- —
- Total cash needed
- —
Loan-product check · same deal, 3 products live
Conventional
25% down · 7.5% · 30yr
- Down + closing
- —
- Monthly P&I
- —
- Monthly cashflow
- —
- DSCR
- —
- Eligible?
- —
Personal DTI + credit; lowest rate.
DSCR
20% down · 8.5% · 30yr
- Down + closing
- —
- Monthly P&I
- —
- Monthly cashflow
- —
- DSCR
- —
- Eligible?
- —
No personal income docs; deal must DSCR.
Hard money
10% down · 12.0% · 12mo
- Down + closing
- —
- Monthly P&I
- —
- Monthly cashflow
- —
- DSCR
- —
- Eligible?
- —
Short-term bridge; refi at stabilization.
Rent comps 2 comps
| Address | Beds | Baths | Sqft | Rent | $/sqft | DOM | Units | Dist |
|---|---|---|---|---|---|---|---|---|
| 601 S Central St Buckner, MO | 3.0 | 1.0 | 1244 | $1,620 | $1.30 | 25d | 1 | 0.86mi |
| 203 Village Ln Buckner, MO | 3.0 | 1.5 | 1400 | $1,595 | $1.14 | 45d | 1 | 1.34mi |
Listing history 2 events
-
2026-06-18remarks 21-char remark
-
2026-06-18$75,000 Pending 1 DOM
ⓘ Source: listings_history table (triggers on properties + properties_extension) + one-shot
backfill from property_details.listing_events for pre-trigger history.
Tax reassessment forecast MO · Resets to sale price
- Current annual tax
- $1,507 · $126/mo
- Projected year-2 tax
- $1,507 · $126/mo
- Expected delta
- $0/yr ($0/mo · 0.0%)
ⓘ Screening estimate from a state-policy table — verify with the county assessor before closing.
Climate risk First Street
- Flood 1/10 Low FEMA zone AE · 0% chance over 30 yrs
- Wildfire 1/10 Low
- Heat 4/10 Moderate 7 d/yr ≥107°F today · 16 d/yr by 30 yrs out
- Wind 2/10 Low
- Air quality 4/10 Moderate 4 unhealthy d/yr today · 5 by 30 yrs out
Nearby sold comps map
Loading sold comps map…
Walkable amenities ~0.75 mi
Loading nearby amenities…
Taxation est. · year 1
- Rental income
- $19,331
- − Mortgage interest
- −$4,201
- − Property taxes
- −$1,507
- − Insurance
- −$5,494
- − Repairs & maintenance
- −$1,546
- − Management
- −$1,546
- − Depreciation
- −$2,182
- Taxable income
- $2,854
- Est. tax owed @ 24.0%
- −$685
- After-tax cash flow
- $2,866/yr
For passive investors: Depreciation is non-cash, so a rental often shows a tax loss while cash-flowing — sheltering income. Rental losses are passive: they offset passive income freely, and up to $25,000/yr can offset ordinary (W-2) income if you actively participate and your MAGI is under $100k (phasing out to $0 by $150k); unused losses carry forward. On sale, claimed depreciation is recaptured at up to 25%, and gains may owe capital-gains tax (a 1031 exchange can defer both). Figures are a year-1 estimate at your 24.0% rate — not tax advice; consult a CPA.
Schools (NCES district)
- District
- Fort Osage R-I
- NCES district ID
- 2912290
- Math proficiency
- 28% ▼ -7.00%
- Reading proficiency
- 39% ▼ -5.00%
- Median HH income
- $57,441
- Composite
- 29.78/100
- National rank
- #6428
- State rank
- #213 of 324 in MO
Livability — Buckner
- Score
- 70/100
- State rank
- #134
- US rank
- #7746
Category grades
Schools grade is shown separately in the Schools card above.
Census & demographics
- Census place
- Buckner, MO
- Population (ZIP)
- 4,700
Population outlook (Jackson County) Hauer SSP2
- Today (2025)
- 719,589 people
- By 2030
- 731,456 · +1.6%
- By 2040
- 746,689 · +3.8%
- By 2050
- 749,289 · +4.1%
- By 2075
- 736,227 · +2.3%
- By 2100
- 668,210 · -7.1%
Race, ethnicity, and origin ACS 2023
- Neighborhood character
- Predominantly White (90%)
- Race & ethnicity
- White 90% Two or more races 6% Hispanic / Latino 4%
- Common ancestry
- Italian 26% Portuguese 2% Lithuanian 2%
- Foreign-born
- 1% · Canada
Political lean MEDSL · Jackson
- 2024 margin
- D (+19.3) · D 58.9% · R 39.5% · Other 1.6%
- 2008→2024 swing
- -6.1pp toward R · 2008: 25.4pp · 2024: 19.3pp
- All cycles
- 2024: D+19.3 2020: D+22.0 2016: D+16.6 2012: D+19.0 2008: D+25.4
Not yet ingested
- Civics
- —
Market trends
- HPI YoY
- ▼ -100.53%
- Current HPI
- 242.6079
- Rent YoY
- —
- Metro
- —
- State GDP YoY
- ▲ 1.84%
- F500 in state
- 20
Industry mix (Fortune 500 HQ in MO)
| Industry | F500 HQs | Revenue |
|---|---|---|
| Healthcare | 1 | $163B |
|
||
| Insurance | 1 | $21B |
|
||
| Industrial Technology | 1 | $17B |
|
||
| Retail | 1 | $16B |
|
||
| Industrial Distribution | 1 | $10B |
|
||
| Utilities | 1 | $9B |
|
||
Price history
+66.7% since first listed8 events — show timeline
- 2026-06-18 Pending — Heartland MLS as Distributed by MLS Grid
- 2026-06-18 Listed $75,000 Heartland MLS as Distributed by MLS Grid
- 2006-11-01 Sold (Public Records) — Public Records
- 2006-10-27 Sold (MLS) — Heartland MLS as Distributed by MLS Grid
- 2005-11-10 Listed $53,500 Heartland MLS as Distributed by MLS Grid
- 2000-03-02 Sold (MLS) — Heartland MLS as Distributed by MLS Grid
- 2000-02-28 Sold (Public Records) — Public Records
- 2000-01-04 Listed $45,000 Heartland MLS as Distributed by MLS Grid
Property tax history
+4.3%/yrLatest (2025): $1,507 · -12.5% YoY. Source: county tax records.
Cash-flow waterfall
monthlySold comps — $/sqft
last 12 mo · ≤1 miLoading sold comps…