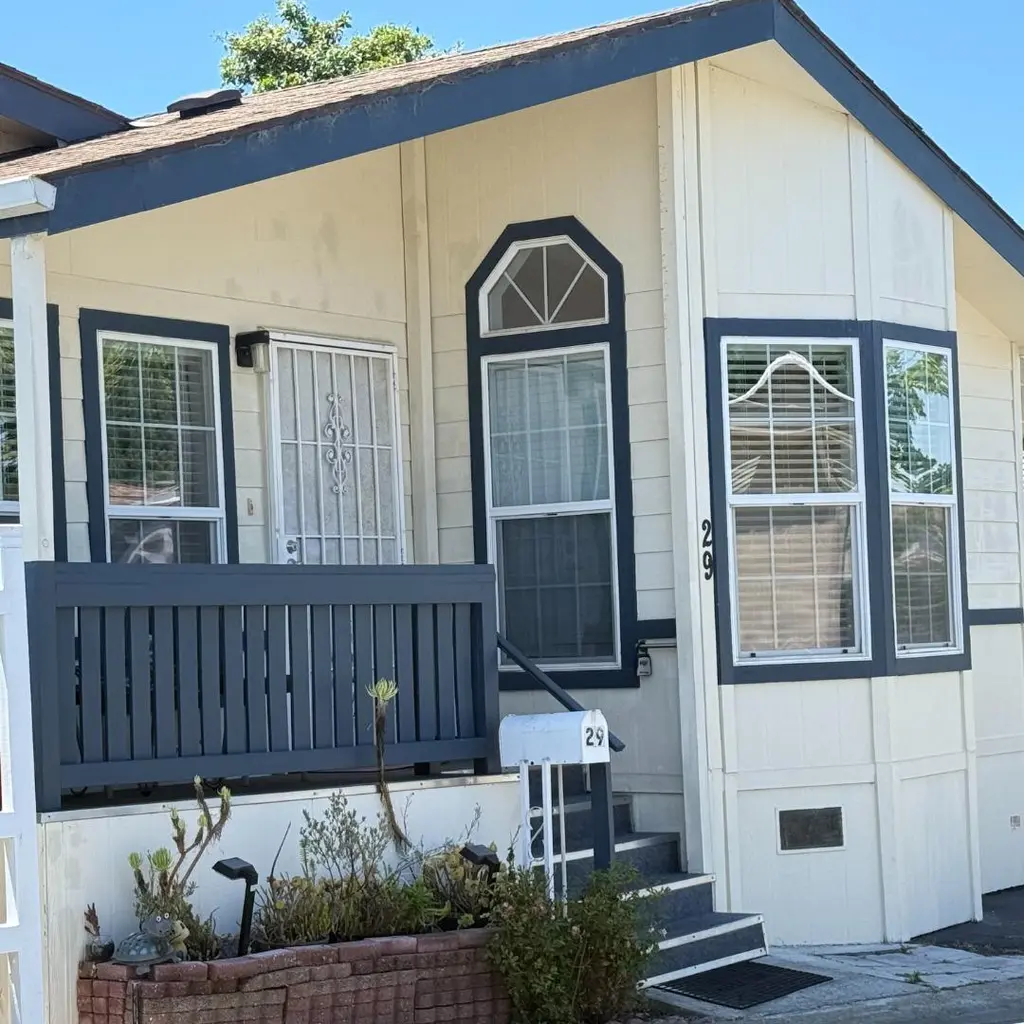
1200 W Winton Ave #29
Hayward, CA 94545
$315,000D+
3 bd · 2.0 ba ·
1,230 sqft ·
Built 2002
· Manufactured
· Active
· 14 DOM
Cashflow @ list (25.0% down · 7.5%)
Estimated rent
$3,315/mo
Mortgage (P&I)
−$1,652
Tax + insurance
−$525
HOA
−$0
Vac / Maint / Mgmt
−$696
Net cashflow
$442/mo
Annual
$5,307/yr
Cap rate
7.98%
Cash-on-cash
6.02%
DSCR
1.27
1% rule
1.05%
Cash to close
$88,200
Investor read
- This is a 3-bed/2.0-bath manufactured listed at $315k.
- At list price, monthly cash flow is $442 ($5k/yr) — positive.
- The deal already cash-flows at list — no discount required.
- Meets the 1% rule at list price ($3k rent vs $315k).
- Only 14 days on market — expect competitive offers; lowballing is unlikely to land.
- Local home prices are declining (-3.0%/yr); year-one equity from $2k of loan paydown is wiped out by about $9k of value loss. Plan a longer hold.
- Location reads 75/100 on livability (#124 in CA, #4,294 nationally) — a middle-class / working-renter tenant base. Strengths: commute A+, employment A+, health & safety A+; Watch: schools D, crime F, cost of living F.
- Hayward Unified (urban): math 25% / reading 37% proficiency, ranked #935 of 1,400 in CA (top 67%) — families likely to look elsewhere, expect single-tenant / working-renter base with shorter leases; 61% free/reduced lunch — lower-income household profile, screen leases tightly.
- Market conditions: Rents rising (+2.6%/yr); 70 active listings in the ZIP; 20 comparable units currently listed for rent nearby; rentals leasing fast (median 5d on market — plan ~1-2 weeks tenant-placement turnaround); high-income renter base; 1,742 units permitted in Alameda County in 2024 (856 in 5+ unit buildings).
- Alameda County population projected at +34% by 2050 — long-run rental-demand tailwind backs the buy-and-hold thesis.
- 4 sale attempts since 8y ago with the ask held roughly flat each time — persistent listings suggest the price (not the market) is what's stuck; bring a comps-based counter.
- Current owner paid $190k; list at $315k implies a 66% gain — meaningful room to come down on a strong offer.
- Cap rate 8.0% vs local median 2.1% in Hayward — top-decile yield for the area; either an underpriced asset or a hidden risk that comps aren't pricing in. Stress-test before assuming the spread holds.
- This rent runs 35% of the median local income ($114k/yr) — at the standard rent-burdened threshold; future hikes will face affordability resistance.
Questions for listing agent
- Is there a deadline driving the sale (1031 exchange, divorce, estate, relocation)? That informs how much negotiation room exists.
- Schools are D-rated, which usually means shorter tenancies and higher turnover. Who's the typical renter profile here, and what's been the actual vacancy rate?
- Crime grade is F in this area — have there been break-ins, vandalism, or insurance claims at this property in the last 3 years? What carrier currently insures it and at what premium?
- The area grade is low — what's the realistic commute time and amenity access for the typical tenant pool here? Any planned neighborhood developments (good or bad) we should know about?
- What's the average days-on-market for RENTAL listings here right now (not sales)? A rising rental-DOM trend means longer vacancies and softer asking-rent achievability than the comps imply.
- What's the recent tenant-quality profile in this submarket — average credit score on applications, eviction rate, late-payment / NSF rate, and stable-employment percentage? A property-management company in the area should have these aggregated.
- How much new for-sale + rental construction is in the pipeline within 1–3 miles? Heavy new supply typically softens prices + rents 12–24 months out; constrained supply supports both.
CashFlowRE · CFR-8NDFGM7A2MP4VK
· Data 2 days ago
cashflowre.app · 2026-05-29