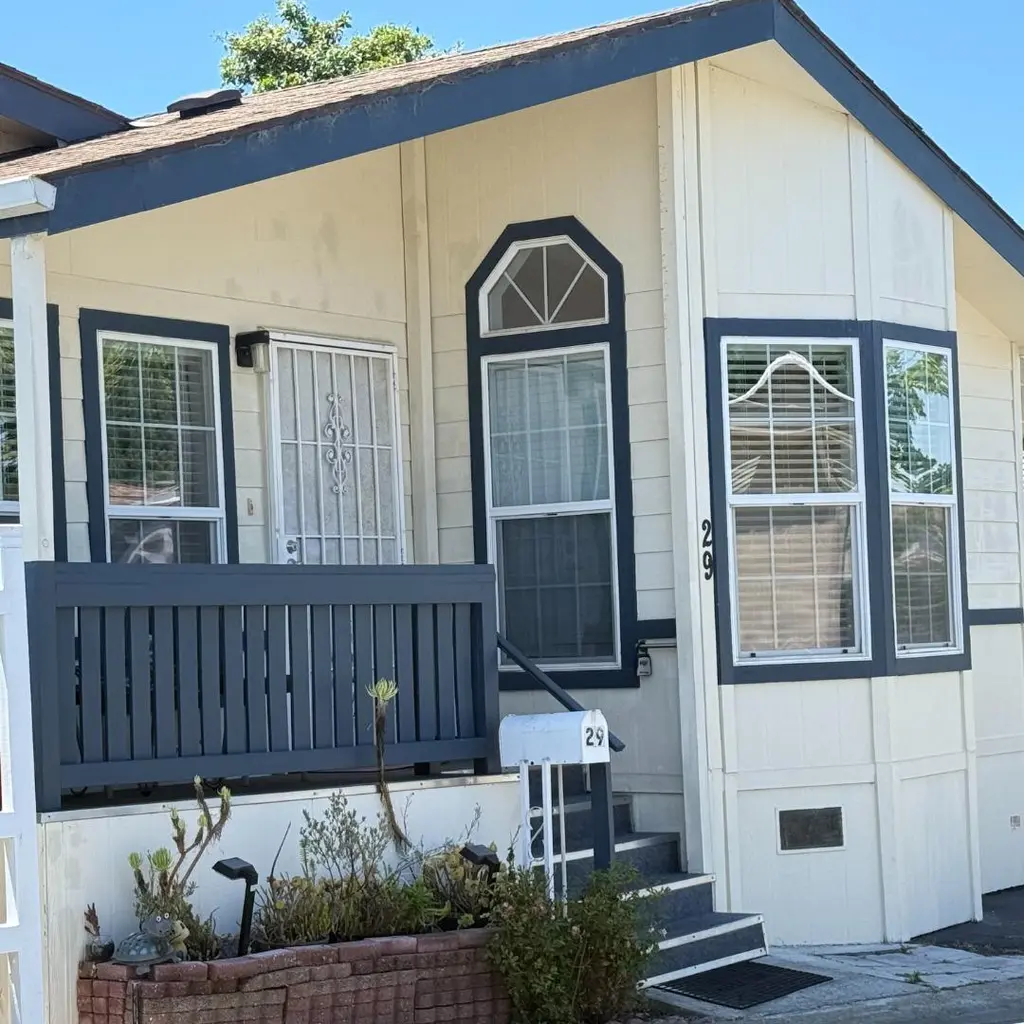
1200 W Winton Ave #29 · Hayward, CA
Flood risk 1/10 · Minimal
- FEMA flood zone
- X (unshaded)
- Chance of flooding over 30 yrs
- 0.0%
- Est. flood insurance / yr
- $507 – $1,088
Fire risk 1/10 · Minimal
- Est. fire insurance / yr
- $659 – $1,223
Heat risk 4/10 · Minor
- Hot days now (above 88°F)
- 7 days/yr
- Hot days in 30 yrs
- 14 days/yr
Wind risk 1/10 · Minimal
- Chance of severe wind over 30 yrs
- —
Air-quality risk 7/10 · Major
- Unhealthy air days now
- 12 days/yr
- Unhealthy air days in 30 yrs
- 12 days/yr
Risk factors via First Street. Map © Google.
Why this score? — see what drove the D+ grade
The composite is a weighted blend of 9 inputs, each scored 0–100. Each bar is that input's sub-score; the figure is the points it added to the 100-point composite (weight × sub-score).
- Cash flow +21.0/30.0
- DSCR +6.7/10.0
- 1% rule +5.5/10.0
- Livability +3.8/5.0
- Rent growth +3.2/5.0
- Schools +3.1/10.0
- Condition / age +2.5/5.0
- ARV discount +1.7/15.0
- Appreciation +0.0/10.0
$315,000
🖨 Deal sheet 📄 Offer letter ✓ Due diligence
Listing remarks MLS
This is a well-maintained home offering comfort, efficiency, and convenience in a desirable 55+ community. Residence features 3 bedrooms, 2 bathrooms -- perfect for working from home or additional living space. Enjoy the functional kitchen equipped with stove, dishwasher, spacious wood cabinets and large countertop with breakfast nook! The master bathroom has been nicely maintained with a step-in shower. Additional highlights include washer and dryer, backyard sheds. Residents enjoy organized activities, access to pool and clubhouse complete with game room, pool tables and library. Designated car wash area and RV storage is available. Ideally located in central Hayward, this home offers close proximity to shopping, dining, and easy access to major freeways (880, Bay Bridge, Highway 92 etc.)
Key facts
- Functional kitchen
- Clubhouse
- Backyard sheds
Tags
Property features AI
Finance
- Other: Living area approximately 1,230 (source: assessor); Park home site on leased land
- HOA & community: Clubhouse; Community pool; Recreation room; Car wash area
Exterior
- Parking: Carport (2 spaces); Covered parking; Tandem parking; Assigned space 29; Space rent applies
- Security: Security gate; Window bars with quick release
- Utilities: Public sewer; Individual water meter; Individual electric meters; Individual gas meters; Natural gas; Public utilities
- Home design: Single-story; Senior community (one resident 55+ allowed); Pets allowed
- Construction: Information not provided
- Exterior features: Shingle roof; Leased land (park home site)
Interior
- Bedrooms: 3 bedrooms; Ground-floor bedroom; Walk-in closet
- Flooring: Laminate flooring; Vinyl/linoleum flooring; Other (see remarks)
- Bathrooms: 2 full bathrooms; Shower and tub; Stall shower
- Heating & cooling: Central forced air heating
- Interior features: High ceiling; Security gate; Window bars with quick release; Storage
- Laundry & utility: Washer and dryer; Laundry room
Neighborhood map
What this means for you Summary
Snapshot
- This is a 3-bed/2.0-bath manufactured listed at $315k.
Deal economics
- At list price, monthly cash flow is $442 ($5k/yr) — positive.
- The deal already cash-flows at list — no discount required.
- Meets the 1% rule at list price ($3k rent vs $315k).
- Cap rate 8.0% vs local median 2.1% in Hayward — top-decile yield for the area; either an underpriced asset or a hidden risk that comps aren't pricing in. Stress-test before assuming the spread holds.
Location & tenants
- Location reads 75/100 on livability (#124 in CA, #4,294 nationally) — a middle-class / working-renter tenant base. Strengths: commute A+, employment A+, health & safety A+; Watch: schools D, crime F, cost of living F.
- Hayward Unified (urban): math 25% / reading 37% proficiency, ranked #935 of 1,400 in CA (top 67%) — families likely to look elsewhere, expect single-tenant / working-renter base with shorter leases; 61% free/reduced lunch — lower-income household profile, screen leases tightly.
- Market conditions: Rents rising (+2.6%/yr); 70 active listings in the ZIP; 20 comparable units currently listed for rent nearby; rentals leasing fast (median 5d on market — plan ~1-2 weeks tenant-placement turnaround); high-income renter base; 1,742 units permitted in Alameda County in 2024 (856 in 5+ unit buildings).
- This rent runs 35% of the median local income ($114k/yr) — at the standard rent-burdened threshold; future hikes will face affordability resistance.
Forward outlook
- Local home prices are declining (-3.0%/yr); year-one equity from $2k of loan paydown is wiped out by about $9k of value loss. Plan a longer hold.
- Alameda County population projected at +34% by 2050 — long-run rental-demand tailwind backs the buy-and-hold thesis.
Negotiation context
- Only 14 days on market — expect competitive offers; lowballing is unlikely to land.
- 4 sale attempts since 8y ago with the ask held roughly flat each time — persistent listings suggest the price (not the market) is what's stuck; bring a comps-based counter.
- Current owner paid $190k; list at $315k implies a 66% gain — meaningful room to come down on a strong offer.
Questions for the listing agent
- Is there a deadline driving the sale (1031 exchange, divorce, estate, relocation)? That informs how much negotiation room exists.
- Schools are D-rated, which usually means shorter tenancies and higher turnover. Who's the typical renter profile here, and what's been the actual vacancy rate?
- Crime grade is F in this area — have there been break-ins, vandalism, or insurance claims at this property in the last 3 years? What carrier currently insures it and at what premium?
- The area grade is low — what's the realistic commute time and amenity access for the typical tenant pool here? Any planned neighborhood developments (good or bad) we should know about?
- What's the average days-on-market for RENTAL listings here right now (not sales)? A rising rental-DOM trend means longer vacancies and softer asking-rent achievability than the comps imply.
- What's the recent tenant-quality profile in this submarket — average credit score on applications, eviction rate, late-payment / NSF rate, and stable-employment percentage? A property-management company in the area should have these aggregated.
- How much new for-sale + rental construction is in the pipeline within 1–3 miles? Heavy new supply typically softens prices + rents 12–24 months out; constrained supply supports both.
Investment metrics
- 1% rule
- 1.05% ✓
- Cap rate
- 7.98%
- Cash-on-cash
- 6.02%
- DSCR
- 1.27
- GRM
- 7.9
CMA / ARV
- ARV (on-the-fly)
- $279,210
- Comps found
- 12
Show comp detail 12 sales within ~0.75 mi
| Address | Dist | Beds/Ba | Sqft | Sold | Price | $/sf | Match |
|---|---|---|---|---|---|---|---|
| 1200 W Winton Ave #86 | 0.03mi | 2/2.0 (-1) | 1,090 (-11%) | 1mo | $280,000 | $257 | 74 |
| 1200 W Winton #145 | 0.07mi | 2/2.0 (-1) | 1,119 (-9%) | 6mo | $300,000 | $268 | 72 |
| 1200 W Winton Ave #81 | 0.06mi | 2/2.0 (-1) | 1,080 (-12%) | 0mo | $264,900 | $245 | 72 |
| 1150 W Winton Ave #229 | 0.21mi | 2/2.0 (-1) | 1,140 (-7%) | 2mo | $177,000 | $155 | 72 |
| 1200 W Winton Ave #215 | 0.16mi | 2/2.0 (-1) | 1,308 (+6%) | 14mo | $297,500 | $227 | 66 |
| 1150 W Winton Ave #221 | 0.21mi | 2/2.0 (-1) | 1,344 (+9%) | 9mo | $242,000 | $180 | 62 |
| 1200 W Winton Ave #32 | 0.09mi | 2/2.0 (-1) | 1,344 (+9%) | 16mo | $385,000 | $286 | 62 |
| 1200 W Winton #49 | 0.15mi | 2/2.0 (-1) | 1,152 (-6%) | 21mo | $280,000 | $243 | 60 |
| 1200 W Winton Ave. #233 #233 | 0.10mi | 2/2.0 (-1) | 1,120 (-9%) | 21mo | $138,000 | $123 | 58 |
| 1150 W Winton #556 | 0.22mi | 2/2.0 (-1) | 1,368 (+11%) | 14mo | $170,000 | $124 | 54 |
| 1150 W Winton Ave #120 | 0.22mi | 2/2.0 (-1) | 1,344 (+9%) | 23mo | $283,000 | $211 | 50 |
| 1150 W Winton Ave #510 | 0.21mi | 2/2.0 (-1) | 1,368 (+11%) | 22mo | $250,000 | $183 | 48 |
Match score weights: distance 35% · size 25% · config 20% · recency 20%. Top-matched comps best support the ARV.
Projected returns pro-forma
-3.0% appreciation · 2.61% rent growth · sell at horizon
- IRR
- -7.4%
- Equity multiple
- 0.73×
- Total profit
- $-24,121
- Equity at exit
- $46,968
- IRR
- 1.7%
- Equity multiple
- 1.12×
- Total profit
- $10,193
- Equity at exit
- $27,235
Cash invested: $88,200 (down + closing). Projections, not guarantees.
Landlord ↔ Tenant lean methodology
- Overall (STATE)
- 18 Strongly Tenant-Friendly
- State California
- 18 Strongly Tenant-Friendly · D+13
- County
- — inherits STATE
- City
- — inherits STATE
ZIP-level market 94545
- Rents YoY
- 2.6%
- Active inventory
- 70
- Price-to-rent
- 7.9×
Monthly cashflow live
- Estimated rent
- $3,315 high interval (Pro) →
- Mortgage (P&I)
- −$1,652
- Tax est. 1.5%
- −$394 /mo · $4,725/yr
- Insurance
- −$131
- HOA
- −$0
- Vacancy / Maint / Mgmt
- −$696
- Net cashflow
- $442
Break-even live
UW: 25.0% down · 7.5% · 30yr · 1.5% tax · 5.0% vac · 8.0% maint · 8.0% mgmt
Financing live
Cash to close
- Down payment
- $78,750
- Closing costs
- $9,450
- Reserves months
- —
- Total cash needed
- —
Loan-product check · same deal, 3 products live
Conventional
25% down · 7.5% · 30yr
- Down + closing
- —
- Monthly P&I
- —
- Monthly cashflow
- —
- DSCR
- —
- Eligible?
- —
Personal DTI + credit; lowest rate.
DSCR
20% down · 8.5% · 30yr
- Down + closing
- —
- Monthly P&I
- —
- Monthly cashflow
- —
- DSCR
- —
- Eligible?
- —
No personal income docs; deal must DSCR.
Hard money
10% down · 12.0% · 12mo
- Down + closing
- —
- Monthly P&I
- —
- Monthly cashflow
- —
- DSCR
- —
- Eligible?
- —
Short-term bridge; refi at stabilization.
Rent comps 20 comps
| Address | Beds | Baths | Sqft | Rent | $/sqft | DOM | Units | Dist |
|---|---|---|---|---|---|---|---|---|
| 946 Hohener Ave Hayward, CA | 3.0 | 2.0 | 1434 | $3,600 | $2.51 | 14d | 1 | 0.53mi |
| 936 Lucia Ct Hayward, CA | 3.0 | 1.0 | 1350 | $2,875 | $2.13 | 5d | 1 | 0.66mi |
| 22846 Nevada Rd Unit 22846 Hayward, CA | 3.0 | 2.0 | 1053 | $3,795 | $3.60 | 1d | 1 | 0.81mi |
| 22846 Nevada Rd Unit 22850 Hayward, CA | 3.0 | 2.0 | 1247 | $4,095 | $3.28 | 1d | 1 | 0.81mi |
| 22846 Nevada Rd Unit 22854 Hayward, CA | 2.0 | 2.0 | 748 | $3,195 | $4.27 | 43d | 1 | 0.81mi |
| 22846 Nevada Rd Unit 22856 Hayward, CA | 2.0 | 2.0 | 744 | $3,995 | $5.37 | 1d | 1 | 0.81mi |
| 694 Tehama Ave Hayward, CA | 3.0 | 1.5 | 1136 | $3,300 | $2.90 | 1d | 1 | 0.83mi |
| 25000 Copa del Oro Dr #201 Hayward, CA | 2.0 | 2.0 | 855 | $3,000 | $3.51 | 43d | 1 | 0.89mi |
| 22211 S Garden Ave Hayward, CA | 2.0 | 1.0 | 900 | $2,145 | $2.38 | 5d | 2 | 0.95mi |
| 22230 S Garden Ave Hayward, CA | 2.0 | 1.0 | 700 | $2,500 | $3.57 | 5d | 1 | 0.99mi |
| 25800 Industrial Blvd Hayward, CA | 1.0–2.0 | 1.0–2.0 | 820 | $3,128 | $3.81 | 1d | 13 | 1.08mi |
| 22078 Arbor Ave Hayward Acres, CA | 1.0–2.0 | 1.0 | 649 | $2,140 | $3.29 | 20d | 1 | 1.18mi |
| 21944 Arbor Ave Hayward, CA | 2.0 | 1.0 | 800 | $2,895 | $3.62 | 43d | 1 | 1.20mi |
| 1172 Huron Ln Hayward, CA | 3.0 | 2.0 | 1290 | $5,000 | $3.88 | 21d | 1 | 1.22mi |
| 1098 Azalea Ct Hayward, CA | 3.0 | 2.5 | 1332 | $3,500 | $2.63 | 1d | 1 | 1.24mi |
| 280 Flint Ct Hayward Acres, CA | 2.0 | 1.0 | 700 | $2,250 | $3.21 | 3d | 1 | 1.27mi |
| 466 Mackenzie Pl Hayward, CA | 3.0 | 2.0 | 1173 | $3,900 | $3.32 | 24d | 1 | 1.31mi |
| 24663 Amador St Hayward, CA | 1.0–2.0 | 1.0 | 745 | $2,195 | $2.95 | 10d | 2 | 1.37mi |
| 24650 Amador St Hayward, CA | 1.0–3.0 | 1.0–2.0 | 822 | $3,525 | $4.29 | 1d | 15 | 1.39mi |
| 226 Rondale Ct Unit 224 Hayward, CA | 2.0 | 1.0 | 700 | $1,950 | $2.79 | 43d | 1 | 1.48mi |
Listing history 10 events
-
2026-06-18days on market $315,000 Active 14 DOM
-
2026-06-17days on market $315,000 Active 13 DOM
-
2026-06-16days on market $315,000 Active 12 DOM
-
2026-06-15days on market $315,000 Active 11 DOM
-
2026-06-13days on market $315,000 Active 9 DOM
-
2026-06-13days on market $315,000 Active 8 DOM
-
2026-06-09days on market $315,000 Active 5 DOM
-
2026-06-08days on market $315,000 Active 4 DOM
-
2026-06-07remarks 699-char remark
-
2026-06-07$315,000 Active 3 DOM
ⓘ Source: listings_history table (triggers on properties + properties_extension) + one-shot
backfill from property_details.listing_events for pre-trigger history.
Climate risk First Street
- Flood 1/10 Low FEMA zone X (unshaded) · 0% chance over 30 yrs
- Wildfire 1/10 Low
- Heat 4/10 Moderate 7 d/yr ≥88°F today · 14 d/yr by 30 yrs out
- Wind 1/10 Low
- Air quality 7/10 Severe 12 unhealthy d/yr today · 12 by 30 yrs out
Nearby sold comps map
Loading sold comps map…
Walkable amenities ~0.75 mi
Loading nearby amenities…
Taxation est. · year 1
- Rental income
- $39,785
- − Mortgage interest
- −$17,645
- − Property taxes
- −$4,725
- − Insurance
- −$1,575
- − Repairs & maintenance
- −$3,183
- − Management
- −$3,183
- − Depreciation
- −$9,164
- Taxable income
- $311
- Est. tax owed @ 24.0%
- −$75
- After-tax cash flow
- $5,233/yr
For passive investors: Depreciation is non-cash, so a rental often shows a tax loss while cash-flowing — sheltering income. Rental losses are passive: they offset passive income freely, and up to $25,000/yr can offset ordinary (W-2) income if you actively participate and your MAGI is under $100k (phasing out to $0 by $150k); unused losses carry forward. On sale, claimed depreciation is recaptured at up to 25%, and gains may owe capital-gains tax (a 1031 exchange can defer both). Figures are a year-1 estimate at your 24.0% rate — not tax advice; consult a CPA.
Schools (NCES district)
- District
- Hayward Unified
- NCES district ID
- 0616740
- Math proficiency
- 25% ▼ -1.00%
- Reading proficiency
- 37% ▬ 0.00%
- Median HH income
- $65,326
- Composite
- 31.27/100
- National rank
- #11241
- State rank
- #935 of 1400 in CA
Livability — Hayward
- Score
- 75/100
- State rank
- #124
- US rank
- #4294
Category grades
Schools grade is shown separately in the Schools card above.
Census & demographics
- Census place
- Hayward, CA
- County
- Alameda County · 1,614,355 people
- City population
- 191,800
- Metro
- San Francisco-Oakland-Berkeley, CA
- Population (ZIP)
- 32,843
- Household income
- $114,356
- Rent vs Own
- Severe rent burden
- 702.0
Population outlook (Alameda County) Hauer SSP2
- Today (2025)
- 1,928,884 people
- By 2030
- 2,069,146 · +7.3%
- By 2040
- 2,338,405 · +21.2%
- By 2050
- 2,586,608 · +34.1%
- By 2075
- 3,061,911 · +58.7%
- By 2100
- 3,234,133 · +67.7%
Race, ethnicity, and origin ACS 2023
- Neighborhood character
- Diverse neighborhood (Simpson 0.69)
- Race & ethnicity
- Asian 42% Hispanic / Latino 35% Two or more races 12% White 10% Black 8% Native American 1% Pacific Islander 1%
- Hispanic origin (detail)
- Mexican 25%
- Common ancestry
- Italian 1% Russian 1% Romanian 1%
- Foreign-born
- 43% · Canada, China, Vietnam
- Languages at home
- 39% English-only · Spanish 26% Tagalog/Filipino 14% Chinese 7%
Political lean MEDSL · Alameda
- 2024 margin
- Solid D (+53.6) · D 74.6% · R 21.0% · Other 4.4%
- 2008→2024 swing
- -5.9pp toward R · 2008: 59.5pp · 2024: 53.6pp
- All cycles
- 2024: D+53.6 2020: D+62.5 2016: D+64.4 2012: D+59.8 2008: D+59.5
Not yet ingested
- Civics
- —
Market trends
- HPI YoY
- ▼ -974.17%
- Current HPI
- 304.698
- Rent YoY
- ▲ 2.61%
- Metro
- San Francisco-Oakland-Berkeley, CA
- State GDP YoY
- ▲ 3.21%
- F500 in state
- 116
Industry mix (Fortune 500 HQ in CA)
| Industry | F500 HQs | Revenue |
|---|---|---|
| Technology | 27 | $1,492B |
|
||
| Financial Services | 3 | $174B |
|
||
| Retail | 3 | $44B |
|
||
| Insurance | 3 | $26B |
|
||
| Media / Entertainment | 2 | $115B |
|
||
| Pharmaceuticals / Biotech | 2 | $62B |
|
||
Price history
+59.1% since first listed7 events — show timeline
- 2026-06-05 Listed $315,000 bridgeMLS, Bay East AOR, or Contra Costa AOR
- 2026-06-05 Listed $315,000 MLSListings
- 2018-08-01 Sold (MLS) $190,000 bridgeMLS, Bay East AOR, or Contra Costa AOR
- 2018-06-20 Pending — bridgeMLS, Bay East AOR, or Contra Costa AOR
- 2018-06-18 Relisted — bridgeMLS, Bay East AOR, or Contra Costa AOR
- 2018-05-04 Pending — bridgeMLS, Bay East AOR, or Contra Costa AOR
- 2018-04-18 Listed $198,000 bridgeMLS, Bay East AOR, or Contra Costa AOR
Property tax history
+0.1%/yrLatest (2025): $554 · -1.7% YoY. Source: county tax records.
Cash-flow waterfall
monthlySold comps — $/sqft
last 12 mo · ≤1 miLoading sold comps…