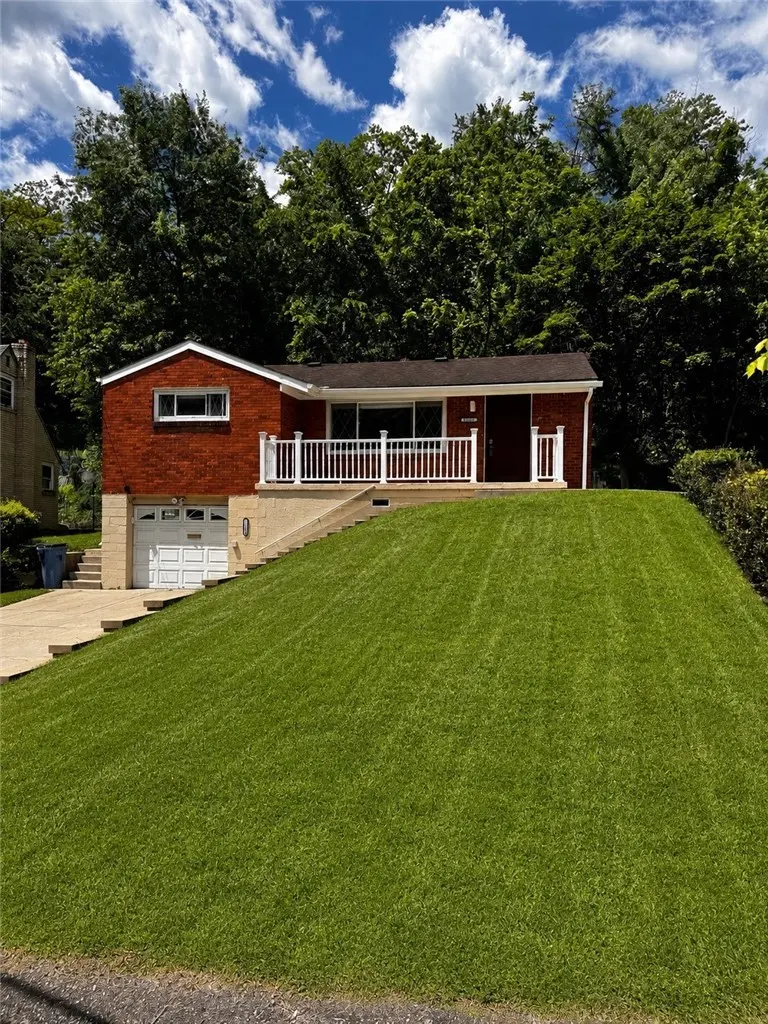
11228 Azalea Dr
Churchill, PA 15235
$165,000F
3 bd · 1.5 ba ·
927 sqft ·
Built 1955
· SingleFamily
· Active
· 9 DOM
Cashflow @ list (25.0% down · 7.5%)
Estimated rent
$1,421/mo
Mortgage (P&I)
−$865
Tax + insurance
−$317
HOA
−$0
Vac / Maint / Mgmt
−$298
Net cashflow
$-59/mo
Annual
$-712/yr
Cap rate
5.86%
Cash-on-cash
-1.54%
DSCR
0.93
1% rule
0.86%
Cash to close
$46,200
Investor read
- This is a 3-bed/1.5-bath single-family listed at $165k.
- At list price, monthly cash flow is $-59 ($-712/yr) — negative.
- To cash-flow at today's rent, offer at most $155k (6.4% below list).
- To meet the 1% rule (rent ≥ 1% of price), the offer needs to be $142k (13.9% below list).
- Only 9 days on market — expect competitive offers; lowballing is unlikely to land.
- Recommended offer: $142k (13.9% below list) — sets the bar for 1% rule.
- Local home prices are declining (-3.0%/yr); year-one equity from $1k of loan paydown is wiped out by about $5k of value loss. Plan a longer hold.
- Location reads 74/100 on livability (#486 in PA, #4,477 nationally) — a middle-class / working-renter tenant base. Strengths: crime A+, employment A+, housing A+; Watch: health & safety D, amenities F, commute F.
- Penn Hills SD (suburban): math 13% / reading 24% proficiency, ranked #496 of 539 in PA (top 92%) — low school quality limits family demand, transient renter base, plan for 1-2y turnover.
- Zoned schools: Penn Hills El Sch (math 14% / reading 27%, grade F, #1,243 of 1,518 statewide, top 82%, 1,279 students, 100% FRL); Linton Ms (math 3% / reading 21%, grade F, #489 of 512 statewide, top 96%, 640 students, 100% FRL); Penn Hills Shs (math 34% / reading 24%, grade F, #357 of 437 statewide, top 82%, 1,107 students, 88% FRL) — zoned schools average 96% FRL vs 56% district-wide (40 pts higher); higher-poverty schools than district average — tighter screening recommended.
- Watch-outs: built in 1955 — expect roof / HVAC / electrical / plumbing capex.
- Market conditions: Rents rising fast (+7.6%/yr); 129 active listings in the ZIP; 16 comparable units currently listed for rent nearby; rentals at typical pace (median 20d on market — plan ~3-4 weeks tenant-placement turnaround); 2,996 units permitted in Allegheny County in 2024 (1,588 in 5+ unit buildings).
- 8 sale attempts since 30y ago with the ask held roughly flat each time — persistent listings suggest the price (not the market) is what's stuck; bring a comps-based counter.
- Current owner paid $107k; list at $165k implies a 54% gain — meaningful room to come down on a strong offer.
- Cap rate 5.9% vs local median 4.6% in Churchill — meaningfully above typical; check what's discounted (condition, days-on-market, listing class) to confirm the premium yield is real.
Questions for listing agent
- What do current leases actually rent for vs. the listed asking? Can we see a recent rent roll and the last 12 months of T-12 income?
- Built in 1955 — when were the roof, HVAC, electrical panel, plumbing, and water heater last replaced?
- Is there a deadline driving the sale (1031 exchange, divorce, estate, relocation)? That informs how much negotiation room exists.
- Schools are B-rated — typically a magnet for longer-tenancy family renters. What's the average tenant stay here, and is there a school-zone premium baked into asking?
- The area grade is low — what's the realistic commute time and amenity access for the typical tenant pool here? Any planned neighborhood developments (good or bad) we should know about?
- What's the average days-on-market for RENTAL listings here right now (not sales)? A rising rental-DOM trend means longer vacancies and softer asking-rent achievability than the comps imply.
- What's the recent tenant-quality profile in this submarket — average credit score on applications, eviction rate, late-payment / NSF rate, and stable-employment percentage? A property-management company in the area should have these aggregated.
- How much new for-sale + rental construction is in the pipeline within 1–3 miles? Heavy new supply typically softens prices + rents 12–24 months out; constrained supply supports both.
CashFlowRE · CFR-8P5690DXVXW4MB
· Data 1 day ago
cashflowre.app · 2026-05-29