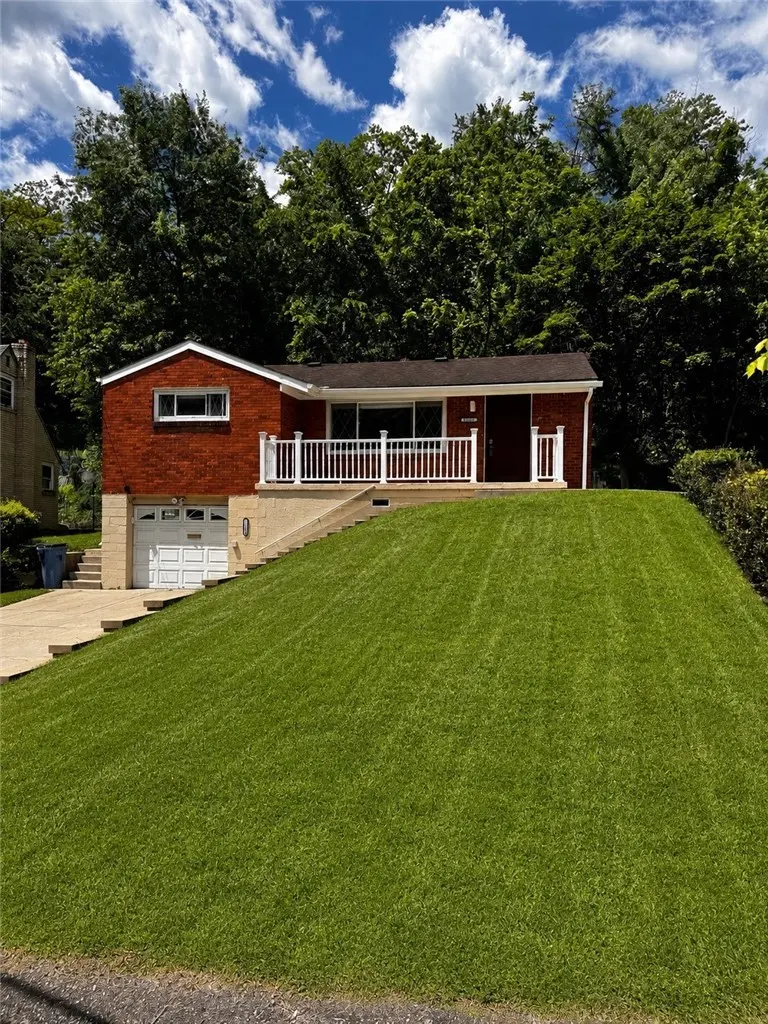
11228 Azalea Dr · Churchill, PA
Flood risk 1/10 · Minimal
- FEMA flood zone
- X (unshaded)
- Chance of flooding over 30 yrs
- 0.0%
- Est. flood insurance / yr
- $473 – $860
Fire risk 1/10 · Minimal
- Est. fire insurance / yr
- $511 – $949
Heat risk 3/10 · Minor
- Hot days now (above 96°F)
- 7 days/yr
- Hot days in 30 yrs
- 16 days/yr
Wind risk 2/10 · Minimal
- Chance of severe wind over 30 yrs
- 0.0%
Air-quality risk 4/10 · Minor
- Unhealthy air days now
- 5 days/yr
- Unhealthy air days in 30 yrs
- 7 days/yr
Risk factors via First Street. Map © Google.
Why this score? — see what drove the F grade
The composite is a weighted blend of 9 inputs, each scored 0–100. Each bar is that input's sub-score; the figure is the points it added to the 100-point composite (weight × sub-score).
- Cash flow +11.3/30.0
- Rent growth +4.4/5.0
- Livability +3.7/5.0
- 1% rule +3.6/10.0
- DSCR +3.3/10.0
- Condition / age +2.5/5.0
- Schools +1.6/10.0
- ARV discount +0.8/15.0
- Appreciation +0.0/10.0
$165,000
🖨 Deal sheet (PDF) 📄 Offer letter ✓ Due diligence
Listing remarks MLS
WOW! 3 BEDROOM * 1.5 BATH * UPDATED RANCH * BEAUTIFUL HARDWOOD FLOORS * CENTRAL AIR CONDITIONING * UPDATED KITCHEN * LEVEL BACK YARD * CEMENT DRIVEWAY * NEWER WINDOWS * LARGE BAY WINDOW IN LIVING ROOM * NEWER BATHROOM * FINISHED GAMEROOM WITH HALF BATH * IDEAL LOCATION * MOVE RIGHT IN * GOOD RENTAL INCOME PROPERTY
Key facts
- Hardwood flooring
- Level backyard
- Updated kitchen
Tags
Property features AI
Exterior
- Parking: Attached garage with built-in garage door opener; One total parking space
- Utilities: Public water; Public sewer
- Home design: Single-story home; Resale property
- Construction: Brick construction; Asphalt roof; Home warranty included
- Exterior features: Public transportation nearby
Interior
- Kitchen: Dishwasher; Microwave; Refrigerator; Stove
- Bedrooms: Three bedrooms on the main level (approx. 12x10, 12x11, 12x12)
- Flooring: Hardwood; Tile
- Bathrooms: One full bathroom; One half bathroom
- Heating & cooling: Gas heating; Central air conditioning
- Interior features: Window screens and window treatments; Walk-out basement access
- Laundry & utility: Washer; Dryer; Some electric appliances
Neighborhood map
What this means for you Summary
Snapshot
- This is a 3-bed/1.5-bath single-family listed at $165k.
Deal economics
- At list price, monthly cash flow is $-59 ($-712/yr) — negative.
- To cash-flow at today's rent, offer at most $155k (6.4% below list).
- To meet the 1% rule (rent ≥ 1% of price), the offer needs to be $142k (13.9% below list).
- Recommended offer: $142k (13.9% below list) — sets the bar for 1% rule.
- Cap rate 5.9% vs local median 4.6% in Churchill — meaningfully above typical; check what's discounted (condition, days-on-market, listing class) to confirm the premium yield is real.
Location & tenants
- Location reads 74/100 on livability (#486 in PA, #4,477 nationally) — a middle-class / working-renter tenant base. Strengths: crime A+, employment A+, housing A+; Watch: health & safety D, amenities F, commute F.
- Penn Hills SD (suburban): math 13% / reading 24% proficiency, ranked #496 of 539 in PA (top 92%) — low school quality limits family demand, transient renter base, plan for 1-2y turnover.
- Zoned schools: Penn Hills El Sch (math 14% / reading 27%, grade F, #1,243 of 1,518 statewide, top 82%, 1,279 students, 100% FRL); Linton Ms (math 3% / reading 21%, grade F, #489 of 512 statewide, top 96%, 640 students, 100% FRL); Penn Hills Shs (math 34% / reading 24%, grade F, #357 of 437 statewide, top 82%, 1,107 students, 88% FRL) — zoned schools average 96% FRL vs 56% district-wide (40 pts higher); higher-poverty schools than district average — tighter screening recommended.
- Market conditions: Rents rising fast (+7.6%/yr); 129 active listings in the ZIP; 16 comparable units currently listed for rent nearby; rentals at typical pace (median 20d on market — plan ~3-4 weeks tenant-placement turnaround); 2,996 units permitted in Allegheny County in 2024 (1,588 in 5+ unit buildings).
Forward outlook
- Local home prices are declining (-3.0%/yr); year-one equity from $1k of loan paydown is wiped out by about $5k of value loss. Plan a longer hold.
Negotiation context
- Only 9 days on market — expect competitive offers; lowballing is unlikely to land.
- 8 sale attempts since 30y ago with the ask held roughly flat each time — persistent listings suggest the price (not the market) is what's stuck; bring a comps-based counter.
- Current owner paid $107k; list at $165k implies a 54% gain — meaningful room to come down on a strong offer.
Risks & watch-outs
- Watch-outs: built in 1955 — expect roof / HVAC / electrical / plumbing capex.
Questions for the listing agent
- What do current leases actually rent for vs. the listed asking? Can we see a recent rent roll and the last 12 months of T-12 income?
- Built in 1955 — when were the roof, HVAC, electrical panel, plumbing, and water heater last replaced?
- Is there a deadline driving the sale (1031 exchange, divorce, estate, relocation)? That informs how much negotiation room exists.
- Schools are B-rated — typically a magnet for longer-tenancy family renters. What's the average tenant stay here, and is there a school-zone premium baked into asking?
- The area grade is low — what's the realistic commute time and amenity access for the typical tenant pool here? Any planned neighborhood developments (good or bad) we should know about?
- What's the average days-on-market for RENTAL listings here right now (not sales)? A rising rental-DOM trend means longer vacancies and softer asking-rent achievability than the comps imply.
- What's the recent tenant-quality profile in this submarket — average credit score on applications, eviction rate, late-payment / NSF rate, and stable-employment percentage? A property-management company in the area should have these aggregated.
- How much new for-sale + rental construction is in the pipeline within 1–3 miles? Heavy new supply typically softens prices + rents 12–24 months out; constrained supply supports both.
Investment metrics
- 1% rule
- 0.86% ✗
- Cap rate
- 5.86%
- Cash-on-cash
- -1.54%
- DSCR
- 0.93
- GRM
- 9.7
CMA / ARV
- ARV (on-the-fly)
- $143,685
- Comps found
- 12
Show comp detail 12 sales within ~0.75 mi
| Address | Dist | Beds/Ba | Sqft | Sold | Price | $/sf | Match |
|---|---|---|---|---|---|---|---|
| 11337 Althea Rd | 0.15mi | 3/1.0 | 910 (-2%) | 9mo | $186,900 | $205 | 80 |
| 330 Wilson Dr | 0.38mi | 2/2.0 (-1) | 956 (+3%) | 4mo | $128,000 | $134 | 67 |
| 326 Dorothy Dr | 0.27mi | 3/1.0 | 956 (+3%) | 19mo | $91,047 | $95 | 65 |
| 10804 Highpoint Dr | 0.13mi | 2/2.0 (-1) | 992 (+7%) | 14mo | $150,000 | $151 | 64 |
| 10816 Highpoint Dr | 0.10mi | 2/2.0 (-1) | 992 (+7%) | 17mo | $75,000 | $76 | 62 |
| 165 Spring Grove Rd | 0.27mi | 2/2.0 (-1) | 1,040 (+12%) | 1mo | $150,000 | $144 | 59 |
| 11420 Azalea Dr | 0.33mi | 3/1.0 | 1,040 (+12%) | 9mo | $192,000 | $185 | 55 |
| 419 Elias Dr | 0.63mi | 3/1.0 | 976 (+5%) | 9mo | $152,500 | $156 | 52 |
| 325 Walpole Dr | 0.75mi | 3/1.0 | 975 (+5%) | 9mo | $167,000 | $171 | 47 |
| 4940 3rd St | 0.74mi | 2/1.5 (-1) | 1,025 (+11%) | 0mo | $195,000 | $190 | 42 |
| 221 Crestview Rd | 0.64mi | 3/1.5 | 1,030 (+11%) | 14mo | $160,000 | $155 | 40 |
| 77 Duff Rd | 0.69mi | 2/1.0 (-1) | 1,050 (+13%) | 2mo | $8,755 | $8 | 36 |
Match score weights: distance 35% · size 25% · config 20% · recency 20%. Top-matched comps best support the ARV.
Projected returns pro-forma
-3.0% appreciation · 7.63% rent growth · sell at horizon
- IRR
- -13.6%
- Equity multiple
- 0.49×
- Total profit
- $-23,540
- Equity at exit
- $24,602
- IRR
- 1.5%
- Equity multiple
- 1.13×
- Total profit
- $6,122
- Equity at exit
- $14,266
Cash invested: $46,200 (down + closing). Projections, not guarantees.
Landlord ↔ Tenant lean methodology
- Overall (STATE)
- 62 Landlord-Friendly
- State Pennsylvania
- 62 Landlord-Friendly · EVEN
- County
- — inherits STATE
- City
- — inherits STATE
ZIP-level market 15235
- Home prices YoY
- -34.1%
- Rents YoY
- 7.6%
- Active inventory
- 129
- Price-to-rent
- 9.7×
Monthly cashflow live
- Estimated rent
- $1,421 high interval (Pro) →
- Mortgage (P&I)
- −$865
- Tax from tax record
- −$248 /mo · $2,977/yr
- Insurance
- −$69
- HOA
- −$0
- Vacancy / Maint / Mgmt
- −$298
- Net cashflow
- $-59
Break-even live
Sensitivity live
| Price | -10% $34 | -5% $-13 | +0% $-59 | +5% $-106 | +10% $-153 |
|---|---|---|---|---|---|
| Rent | -10% $-172 | -5% $-115 | +0% $-59 | +5% $-3 | +10% $53 |
| Rate | -1.0pp $24 | -0.5pp $-17 | base $-59 | +0.5pp $-102 | +1.0pp $-146 |
UW: 25.0% down · 7.5% · 30yr · 1.5% tax · 5.0% vac · 8.0% maint · 8.0% mgmt
Financing live
Cash to close
- Down payment
- $41,250
- Closing costs
- $4,950
- Reserves months
- —
- Total cash needed
- —
Loan-product check · same deal, 3 products live
Conventional
25% down · 7.5% · 30yr
- Down + closing
- —
- Monthly P&I
- —
- Monthly cashflow
- —
- DSCR
- —
- Eligible?
- —
Personal DTI + credit; lowest rate.
DSCR
20% down · 8.5% · 30yr
- Down + closing
- —
- Monthly P&I
- —
- Monthly cashflow
- —
- DSCR
- —
- Eligible?
- —
No personal income docs; deal must DSCR.
Hard money
10% down · 12.0% · 12mo
- Down + closing
- —
- Monthly P&I
- —
- Monthly cashflow
- —
- DSCR
- —
- Eligible?
- —
Short-term bridge; refi at stabilization.
Rent comps 16 comps
| Address | Beds | Baths | Sqft | Rent | $/sqft | DOM | Units | Dist |
|---|---|---|---|---|---|---|---|---|
| 457 Elias Dr #445 Pittsburgh, PA | 2.0 | 1.0 | 888 | $1,200 | $1.35 | 19d | 1 | 0.53mi |
| 124 Dauntless Dr Pittsburgh, PA | 3.0 | 1.0 | 1100 | $1,395 | $1.27 | 25d | 1 | 0.72mi |
| 1426 Homestead Rd Unit 3 Verona, PA | 3.0 | 1.0 | 1000 | $1,499 | $1.50 | 14d | 1 | 0.87mi |
| 261 Universal Rd Unit 261UNIV Pittsburgh, PA | 3.0 | 1.0 | 1100 | $1,225 | $1.11 | 5d | 1 | 0.97mi |
| 62 Melvin Ct Penn Hills Township, PA | 1.0–2.0 | 1.0 | 825 | $1,549 | $1.88 | 9d | 2 | 0.97mi |
| 5725 Verona Rd Unit 2 Verona, PA | 2.0 | 1.0 | 850 | $1,200 | $1.41 | 25d | 1 | 1.04mi |
| 5725 Verona Rd #1 Verona, PA | 2.0 | 1.0 | 800 | $1,300 | $1.62 | 25d | 1 | 1.04mi |
| 10043 Calvin St Pittsburgh, PA | 2.0 | 1.0 | 778 | $1,195 | $1.54 | 45d | 1 | 1.16mi |
| 127 Stowe Dr Pittsburgh, PA | 3.0 | 1.0 | 948 | $1,495 | $1.58 | 23d | 1 | 1.20mi |
| 325 Poe Dr Pittsburgh, PA | 2.0 | 1.0 | 1056 | $1,599 | $1.51 | 45d | 1 | 1.25mi |
| 154 Collins Dr Pittsburgh, PA | 3.0 | 1.0 | 986 | $1,295 | $1.31 | 4d | 1 | 1.26mi |
| 3005 Laketon Rd Pittsburgh, PA | 3.0 | 1.0 | 1100 | $1,295 | $1.18 | 16d | 1 | 1.27mi |
| 610 Churchill Ave Pittsburgh, PA | 3.0 | 1.0 | 1100 | $1,395 | $1.27 | 4d | 1 | 1.28mi |
| 185 Howard St Pittsburgh, PA | 2.0 | 1.0 | 1000 | $1,250 | $1.25 | 45d | 1 | 1.37mi |
| 648 Southern Ave Penn Hills, PA | 3.0 | 1.0 | 1100 | $1,600 | $1.45 | 9d | 1 | 1.38mi |
| 6388 Saltsburg Rd Pittsburgh, PA | 2.0 | 1.5 | 875 | $1,300 | $1.49 | 5d | 1 | 1.48mi |
Listing history 8 events
-
2026-06-21days on market $165,000 Active 9 DOM
-
2026-06-18days on market $165,000 Active 6 DOM
-
2026-06-17days on market $165,000 Active 5 DOM
-
2026-06-16days on market $165,000 Active 4 DOM
-
2026-06-15status $165,000 Active 3 DOM
-
2026-06-02status $165,000 Pending 3 DOM
-
2026-06-01days on market $165,000 Active 3 DOM
-
2026-05-31days on market $165,000 Active 2 DOM
ⓘ Source: listings_history table (triggers on properties + properties_extension) + one-shot
backfill from property_details.listing_events for pre-trigger history.
Tax reassessment forecast PA · Partial reset (capped growth)
- Current annual tax
- $2,977 · $248/mo
- Projected year-2 tax
- $2,977 · $248/mo
- Expected delta
- $0/yr ($0/mo · 0.0%)
ⓘ Screening estimate from a state-policy table — verify with the county assessor before closing.
Climate risk First Street
- Flood 1/10 Low FEMA zone X (unshaded) · 0% chance over 30 yrs
- Wildfire 1/10 Low
- Heat 3/10 Moderate 7 d/yr ≥96°F today · 16 d/yr by 30 yrs out
- Wind 2/10 Low 0% chance of damaging wind over 30 yrs
- Air quality 4/10 Moderate 5 unhealthy d/yr today · 7 by 30 yrs out
Nearby sold comps map
Loading sold comps map…
Walkable amenities ~0.75 mi
Loading nearby amenities…
Taxation est. · year 1
- Rental income
- $17,055
- − Mortgage interest
- −$9,243
- − Property taxes
- −$2,977
- − Insurance
- −$825
- − Repairs & maintenance
- −$1,364
- − Management
- −$1,364
- − Depreciation
- −$4,800
- Taxable loss
- −$3,519
- Est. tax savings @ 24.0%
- +$844
- After-tax cash flow
- $132/yr
For passive investors: Depreciation is non-cash, so a rental often shows a tax loss while cash-flowing — sheltering income. Rental losses are passive: they offset passive income freely, and up to $25,000/yr can offset ordinary (W-2) income if you actively participate and your MAGI is under $100k (phasing out to $0 by $150k); unused losses carry forward. On sale, claimed depreciation is recaptured at up to 25%, and gains may owe capital-gains tax (a 1031 exchange can defer both). Figures are a year-1 estimate at your 24.0% rate — not tax advice; consult a CPA.
Schools (NCES district)
- District
- Penn Hills SD
- NCES district ID
- 4218590
- Math proficiency
- 13% ▼ -6.00%
- Reading proficiency
- 24% ▼ -14.00%
- Median HH income
- $47,794
- Composite
- 16.42/100
- National rank
- #9192
- State rank
- #496 of 539 in PA
Livability — Churchill
- Score
- 74/100
- State rank
- #486
- US rank
- #4477
Category grades
Schools grade is shown separately in the Schools card above.
Census & demographics
- County
- Allegheny County · 1,022,028 people
- Metro
- Pittsburgh, PA
- Population (ZIP)
- 33,951
- Household income
- $67,240
- Rent vs Own
- Severe rent burden
- 955.0
Population outlook (Allegheny County) Hauer SSP2
- Today (2025)
- 1,250,282 people
- By 2030
- 1,256,482 · +0.5%
- By 2040
- 1,256,318 · +0.5%
- By 2050
- 1,244,169 · -0.5%
- By 2075
- 1,197,693 · -4.2%
- By 2100
- 1,093,187 · -12.6%
Race, ethnicity, and origin ACS 2023
- Neighborhood character
- Diverse neighborhood (Simpson 0.58)
- Race & ethnicity
- White 51% Black 40% Two or more races 7% Hispanic / Latino 2%
- Common ancestry
- Romanian 5% Serbian 2% Slovak 1%
- Foreign-born
- 4% · Canada
- Languages at home
- 97% English-only · Other Indo-European 1% Spanish 1%
Political lean MEDSL · Allegheny
- 2024 margin
- Strong D (+20.3) · D 59.7% · R 39.4%
- 2008→2024 swing
- +4.8pp toward D · 2008: 15.5pp · 2024: 20.3pp
- All cycles
- 2024: D+20.3 2020: D+20.4 2016: D+16.4 2012: D+14.4 2008: D+15.5
Not yet ingested
- Civics
- —
Market trends
- HPI YoY
- ▼ -121.68%
- Current HPI
- 235.4861
- Rent YoY
- ▲ 7.63%
- Metro
- Pittsburgh, PA
- State GDP YoY
- ▲ 1.68%
- F500 in state
- 34
Industry mix (Fortune 500 HQ in PA)
| Industry | F500 HQs | Revenue |
|---|---|---|
| Healthcare | 2 | $309B |
|
||
| Insurance | 2 | $27B |
|
||
| Telecommunications / Media | 1 | $124B |
|
||
| Industrial Distribution | 1 | $22B |
|
||
| Financial Services | 1 | $20B |
|
||
| Chemicals / Materials | 1 | $18B |
|
||
Price history
+190.0% since first listed21 events — show timeline
- 2026-05-29 Listed $165,000 West Penn MLS
- 2020-08-06 Sold (Public Records) $107,000 Public Records
- 2020-07-30 Pending — West Penn MLS
- 2020-07-29 Sold (MLS) $107,000 West Penn MLS
- 2020-05-29 Contingent — West Penn MLS
- 2020-05-13 Delisted — West Penn MLS
- 2020-05-12 Listed $105,000 West Penn MLS
- 2019-05-23 Listed $105,000 West Penn MLS
- 2019-05-14 Delisted — West Penn MLS
- 2018-05-15 Listed $120,000 West Penn MLS
- 2015-04-16 Delisted — West Penn MLS
- 2015-04-10 Listed $115,000 West Penn MLS
- 2014-01-08 Sold (Public Records) $28,299 Public Records
- 2013-12-23 Price Changed $28,299 West Penn MLS
- 2013-12-19 Sold (MLS) $28,299 West Penn MLS
- 2013-12-19 Price Changed $36,000 West Penn MLS
- 2013-11-08 Listed $36,000 West Penn MLS
- 2011-04-07 Listed $32,900 West Penn MLS
- 1997-01-27 Sold (Public Records) $56,000 Public Records
- 1997-01-24 Sold (MLS) $56,000 West Penn MLS
- 1996-11-22 Listed $56,900 West Penn MLS
Property tax history
+2.5%/yrLatest (2026): $2,977 · +0.0% YoY. Source: county tax records.
Cash-flow waterfall
monthlySold comps — $/sqft
last 12 mo · ≤1 miLoading sold comps…