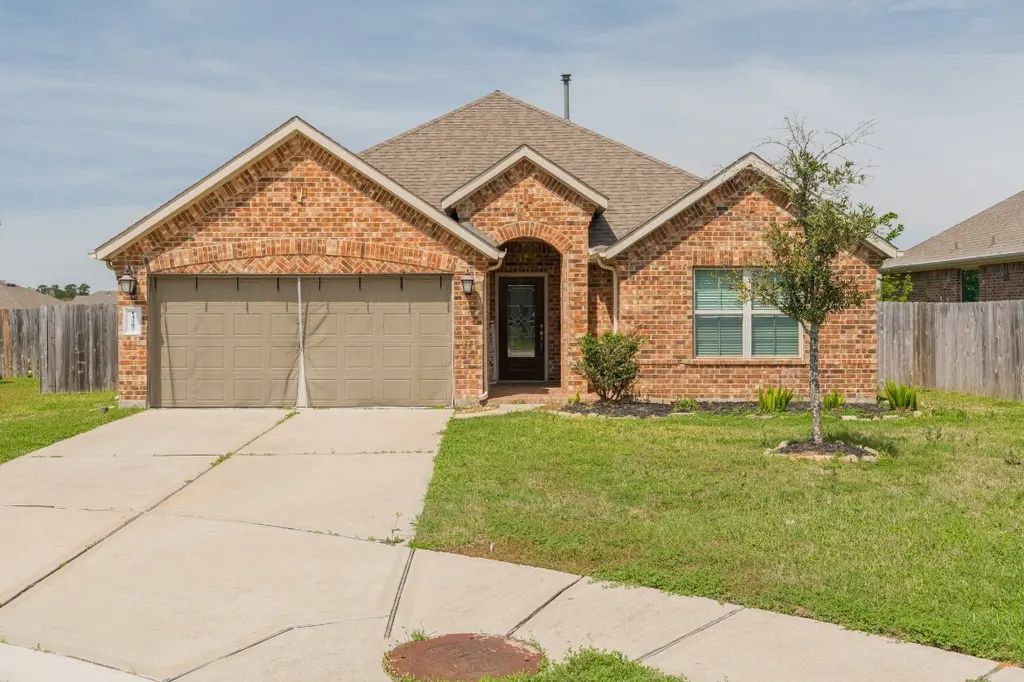
14207 Irvine Ranch Trl
The Woodlands, TX 77384
$334,000D-
4 bd · 3.0 ba ·
2,086 sqft ·
Built 2017
· SingleFamily
· Active
· 121 DOM
Cashflow @ list (25.0% down · 7.5%)
Estimated rent
$2,452/mo
Mortgage (P&I)
−$1,752
Tax + insurance
−$544
HOA
−$71
Vac / Maint / Mgmt
−$515
Net cashflow
$-429/mo
Annual
$-5,149/yr
Cap rate
4.75%
Cash-on-cash
-5.51%
DSCR
0.76
1% rule
0.73%
Cash to close
$93,520
Investor read
- This is a 4-bed/3.0-bath single-family listed at $334k.
- At list price, monthly cash flow is $-429 ($-5k/yr) — negative.
- To cash-flow at today's rent, offer at most $258k (22.7% below list).
- To meet the 1% rule (rent ≥ 1% of price), the offer needs to be $245k (26.6% below list).
- It's been on market 121 days — a 12% lower offer ($294k) is reasonable based on typical stale-listing flexibility.
- Recommended offer: $245k (26.6% below list) — sets the bar for 1% rule.
- Local home prices are declining (-3.0%/yr); year-one equity from $2k of loan paydown is wiped out by about $10k of value loss. Plan a longer hold.
- Location reads 91/100 on livability (#1 in TX, #47 nationally) — a professional / high-income tenant draw. Strengths: schools A+, amenities A+, commute A+; Watch: cost of living D-.
- Conroe ISD (other): math 57% / reading 57% proficiency, ranked #69 of 826 in TX (top 8%) — acceptable for families but not a draw, mixed tenant base, ~2y average lease.
- Market conditions: Rents flat; 310 active listings in the ZIP; 7 comparable units currently listed for rent nearby; rentals at typical pace (median 19d on market — plan ~3-4 weeks tenant-placement turnaround); solid renter incomes; 13,259 units permitted in Montgomery County in 2024 (1,402 in 5+ unit buildings).
- Montgomery County population projected at +65% by 2050 — long-run rental-demand tailwind backs the buy-and-hold thesis.
- 6 sale attempts since 6y ago; this cycle's ask is 12746% above the opening price — seller raised mid-cycle; expect resistance to lowballs.
- Climate carrying-cost: severe wind risk, 99% chance of damaging wind over 30y; extreme-heat days projected 7→24/yr by 2055 (HVAC capex compounding) — expect insurance premiums to compound above CPI over the hold.
- Cap rate 4.8% vs local median 2.3% in The Woodlands — top-decile yield for the area; either an underpriced asset or a hidden risk that comps aren't pricing in. Stress-test before assuming the spread holds.
- This rent runs 32% of the median local income ($92k/yr) — at the standard rent-burdened threshold; future hikes will face affordability resistance.
Questions for listing agent
- What do current leases actually rent for vs. the listed asking? Can we see a recent rent roll and the last 12 months of T-12 income?
- It's been on market 121 days. Have you received any prior offers? Is the seller open to a 27% concession, seller financing, or rate buy-down credit?
- What does the HOA fee cover, when was the last increase, and are there any pending special assessments or reserve-fund shortfalls?
- Why hasn't it sold? Are there any deal-killer items the seller is aware of (foundation, flood, title, zoning, code violations)?
- Is there a deadline driving the sale (1031 exchange, divorce, estate, relocation)? That informs how much negotiation room exists.
- Schools are A-rated — typically a magnet for longer-tenancy family renters. What's the average tenant stay here, and is there a school-zone premium baked into asking?
- The area grade is low — what's the realistic commute time and amenity access for the typical tenant pool here? Any planned neighborhood developments (good or bad) we should know about?
- What's the average days-on-market for RENTAL listings here right now (not sales)? A rising rental-DOM trend means longer vacancies and softer asking-rent achievability than the comps imply.
CashFlowRE · CFR-8QF139CXKG9FSV
· Data 2 days ago
cashflowre.app · 2026-05-29