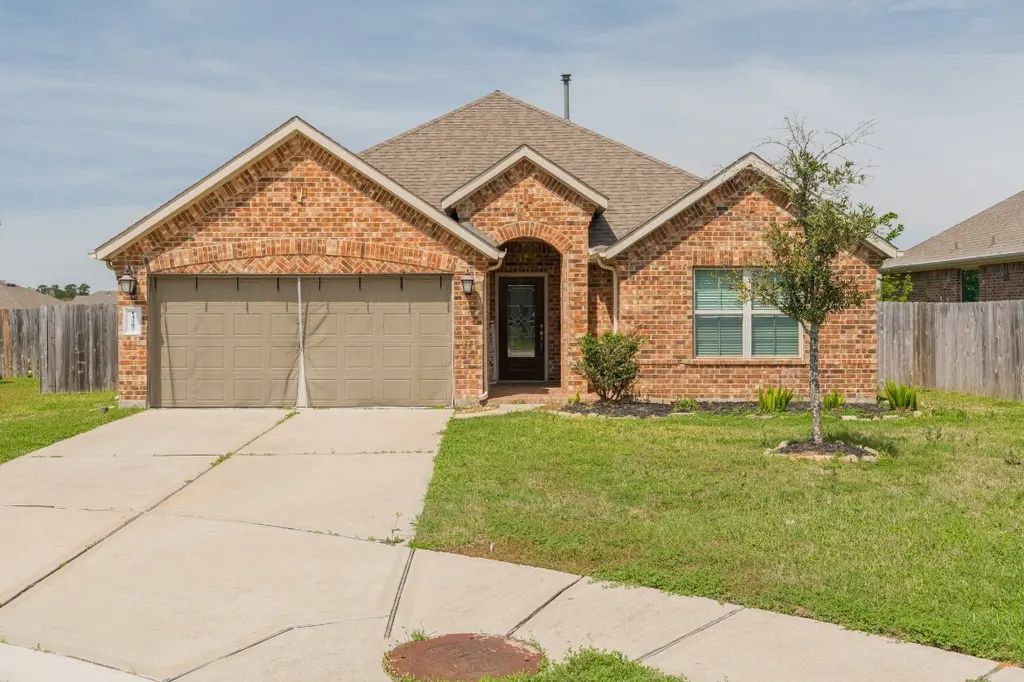
14207 Irvine Ranch Trl · The Woodlands, TX
Flood risk 1/10 · Minimal
- FEMA flood zone
- X (unshaded)
- Chance of flooding over 30 yrs
- 0.0%
- Est. flood insurance / yr
- $507 – $1,088
Fire risk 4/10 · Minor
- Est. fire insurance / yr
- $1,222 – $2,270
Heat risk 9/10 · Severe
- Hot days now (above 112°F)
- 7 days/yr
- Hot days in 30 yrs
- 24 days/yr
Wind risk 8/10 · Major
- Chance of severe wind over 30 yrs
- 99.0%
Air-quality risk 2/10 · Minimal
- Unhealthy air days now
- 2 days/yr
- Unhealthy air days in 30 yrs
- 2 days/yr
Risk factors via First Street. Map © Google.
Why this score? — see what drove the D- grade
The composite is a weighted blend of 9 inputs, each scored 0–100. Each bar is that input's sub-score; the figure is the points it added to the 100-point composite (weight × sub-score).
- ARV discount +12.2/15.0
- Cash flow +7.4/30.0
- Schools +5.1/10.0
- Livability +4.5/5.0
- Rent growth +2.6/5.0
- Condition / age +2.5/5.0
- 1% rule +2.3/10.0
- DSCR +1.6/10.0
- Appreciation +0.0/10.0
$334,000
🖨 Deal sheet 📄 Offer letter ✓ Due diligence
Listing remarks MLS
Nestled in a quiet CUL-DE-SAC, this single-story home boasts numerous upgrades. The spacious layout includes 4 bedrooms, 2 full baths, 42” cabinets, granite countertops, stainless steel appliances, and tile flooring. Additional features include plantation blinds, front door with glass design, gutters, sprinkler system, and finished attic space. The oversized master suite offers a double sink vanity, tub, and shower. Outside, a covered patio with ceiling fans overlooking the backyard. RainSoft water system is included. Residents enjoy access to a pool, playground, and community center, all within the Woodlands Schools district. Don't let this one get away!
Key facts
- Plantation blinds
- Finished attic space
- Covered patio
Tags
Neighborhood map
What this means for you Summary
Snapshot
- This is a 4-bed/3.0-bath single-family listed at $334k.
Deal economics
- At list price, monthly cash flow is $-429 ($-5k/yr) — negative.
- To cash-flow at today's rent, offer at most $258k (22.7% below list).
- To meet the 1% rule (rent ≥ 1% of price), the offer needs to be $245k (26.6% below list).
- Recommended offer: $245k (26.6% below list) — sets the bar for 1% rule.
- Cap rate 4.8% vs local median 2.3% in The Woodlands — top-decile yield for the area; either an underpriced asset or a hidden risk that comps aren't pricing in. Stress-test before assuming the spread holds.
Location & tenants
- Location reads 91/100 on livability (#1 in TX, #47 nationally) — a professional / high-income tenant draw. Strengths: schools A+, amenities A+, commute A+; Watch: cost of living D-.
- Conroe ISD (other): math 57% / reading 57% proficiency, ranked #69 of 826 in TX (top 8%) — acceptable for families but not a draw, mixed tenant base, ~2y average lease.
- Market conditions: Rents flat; 310 active listings in the ZIP; 7 comparable units currently listed for rent nearby; rentals at typical pace (median 19d on market — plan ~3-4 weeks tenant-placement turnaround); solid renter incomes; 13,259 units permitted in Montgomery County in 2024 (1,402 in 5+ unit buildings).
- This rent runs 32% of the median local income ($92k/yr) — at the standard rent-burdened threshold; future hikes will face affordability resistance.
Forward outlook
- Local home prices are declining (-3.0%/yr); year-one equity from $2k of loan paydown is wiped out by about $10k of value loss. Plan a longer hold.
- Montgomery County population projected at +65% by 2050 — long-run rental-demand tailwind backs the buy-and-hold thesis.
Negotiation context
- It's been on market 121 days — a 12% lower offer ($294k) is reasonable based on typical stale-listing flexibility.
- 6 sale attempts since 6y ago; this cycle's ask is 12746% above the opening price — seller raised mid-cycle; expect resistance to lowballs.
Risks & watch-outs
- Climate carrying-cost: severe wind risk, 99% chance of damaging wind over 30y; extreme-heat days projected 7→24/yr by 2055 (HVAC capex compounding) — expect insurance premiums to compound above CPI over the hold.
Questions for the listing agent
- What do current leases actually rent for vs. the listed asking? Can we see a recent rent roll and the last 12 months of T-12 income?
- It's been on market 121 days. Have you received any prior offers? Is the seller open to a 27% concession, seller financing, or rate buy-down credit?
- What does the HOA fee cover, when was the last increase, and are there any pending special assessments or reserve-fund shortfalls?
- Why hasn't it sold? Are there any deal-killer items the seller is aware of (foundation, flood, title, zoning, code violations)?
- Is there a deadline driving the sale (1031 exchange, divorce, estate, relocation)? That informs how much negotiation room exists.
- Schools are A-rated — typically a magnet for longer-tenancy family renters. What's the average tenant stay here, and is there a school-zone premium baked into asking?
- The area grade is low — what's the realistic commute time and amenity access for the typical tenant pool here? Any planned neighborhood developments (good or bad) we should know about?
- What's the average days-on-market for RENTAL listings here right now (not sales)? A rising rental-DOM trend means longer vacancies and softer asking-rent achievability than the comps imply.
- What's the recent tenant-quality profile in this submarket — average credit score on applications, eviction rate, late-payment / NSF rate, and stable-employment percentage? A property-management company in the area should have these aggregated.
- How much new for-sale + rental construction is in the pipeline within 1–3 miles? Heavy new supply typically softens prices + rents 12–24 months out; constrained supply supports both.
Investment metrics
- 1% rule
- 0.73% ✗
- Cap rate
- 4.75%
- Cash-on-cash
- -5.51%
- DSCR
- 0.76
- GRM
- 11.3
CMA / ARV
- ARV (median comp)
- $373,402
- List price
- $334,000
- Delta
- -10.55%
- Verdict
- UNDERPRICED
- Comps
- 20 within 1.0 mi
Show comp detail 12 sales within ~0.75 mi
| Address | Dist | Beds/Ba | Sqft | Sold | Price | $/sf | Match |
|---|---|---|---|---|---|---|---|
| 14307 Garden Creek Ct | 0.36mi | 4/3.0 | 2,103 (+1%) | 6mo | $387,500 | $184 | 77 |
| 14227 Glacier Bay Ct | 0.40mi | 4/2.0 | 2,084 (-0%) | 2mo | $299,500 | $144 | 76 |
| 16016 Birch Bay Ln | 0.52mi | 4/3.0 | 2,113 (+1%) | 0mo | $337,000 | $159 | 73 |
| 14205 Wonder Lake Ln | 0.37mi | 4/3.0 | 2,226 (+7%) | 0mo | $345,000 | $155 | 71 |
| 14233 Wonder Lk | 0.37mi | 4/3.0 | 2,298 (+10%) | 2mo | $299,990 | $131 | 64 |
| 13757 Rising Sun Ln | 0.45mi | 4/2.5 | 2,248 (+8%) | 0mo | $360,000 | $160 | 64 |
| 14136 Lake Lodge Dr | 0.30mi | 4/2.0 | 1,842 (-12%) | 0mo | $348,999 | $189 | 62 |
| 13340 Bear Creek Ct | 0.41mi | 4/3.0 | 2,308 (+11%) | 2mo | $375,000 | $162 | 62 |
| 10023 Angelina Woods Ln | 0.66mi | 4/3.0 | 2,185 (+5%) | 1mo | $368,900 | $169 | 60 |
| 14250 Wonder Lake Ln | 0.35mi | 4/2.0 | 1,855 (-11%) | 2mo | $325,000 | $175 | 59 |
| 12382 New River Trl | 0.67mi | 4/2.0 | 1,895 (-9%) | 1mo | $310,000 | $164 | 48 |
| 14010 Juniper Point Ln | 0.65mi | 4/2.0 | 1,862 (-11%) | 4mo | $375,000 | $201 | 45 |
Match score weights: distance 35% · size 25% · config 20% · recency 20%. Top-matched comps best support the ARV.
Projected returns pro-forma
-3.0% appreciation · 0.44% rent growth · sell at horizon
- IRR
- -28.7%
- Equity multiple
- 0.06×
- Total profit
- $-87,536
- Equity at exit
- $49,800
- IRR
- -42.8%
- Equity multiple
- -0.44×
- Total profit
- $-135,128
- Equity at exit
- $28,878
Cash invested: $93,520 (down + closing). Projections, not guarantees.
Landlord ↔ Tenant lean methodology
- Overall (STATE)
- 87 Strongly Landlord-Friendly
- State Texas
- 87 Strongly Landlord-Friendly · R+5
- County
- — inherits STATE
- City
- — inherits STATE
ZIP-level market 77384
- Home prices YoY
- -22.6%
- Rents YoY
- 0.4%
- Active inventory
- 310
- Price-to-rent
- 11.3×
Monthly cashflow live
- Estimated rent
- $2,452 high interval (Pro) →
- Mortgage (P&I)
- −$1,752
- Tax from tax record
- −$405 /mo · $4,857/yr
- Insurance
- −$139
- HOA
- −$71
- Vacancy / Maint / Mgmt
- −$515
- Net cashflow
- $-429
Break-even live
UW: 25.0% down · 7.5% · 30yr · 1.5% tax · 5.0% vac · 8.0% maint · 8.0% mgmt
Financing live
Cash to close
- Down payment
- $83,500
- Closing costs
- $10,020
- Reserves months
- —
- Total cash needed
- —
Loan-product check · same deal, 3 products live
Conventional
25% down · 7.5% · 30yr
- Down + closing
- —
- Monthly P&I
- —
- Monthly cashflow
- —
- DSCR
- —
- Eligible?
- —
Personal DTI + credit; lowest rate.
DSCR
20% down · 8.5% · 30yr
- Down + closing
- —
- Monthly P&I
- —
- Monthly cashflow
- —
- DSCR
- —
- Eligible?
- —
No personal income docs; deal must DSCR.
Hard money
10% down · 12.0% · 12mo
- Down + closing
- —
- Monthly P&I
- —
- Monthly cashflow
- —
- DSCR
- —
- Eligible?
- —
Short-term bridge; refi at stabilization.
Rent comps 7 comps
| Address | Beds | Baths | Sqft | Rent | $/sqft | DOM | Units | Dist |
|---|---|---|---|---|---|---|---|---|
| 14221 Rainier Peak Xing Conroe, TX | 4.0 | 2.5 | 2289 | $2,446 | $1.07 | 7d | 1 | 0.07mi |
| 9811 Laurel Lake Dr Conroe, TX | 3.0–4.0 | 2.0–2.5 | 1830 | $3,153 | $1.72 | 1d | 1 | 0.53mi |
| 9857 Laurel Lake Dr Shenandoah, TX | 4.0 | 2.0 | 1717 | $2,250 | $1.31 | 22d | 1 | 0.54mi |
| 14273 Lake Lodge Dr Conroe, TX | 4.0 | 3.0 | 2280 | $2,550 | $1.12 | 43d | 1 | 0.58mi |
| 14006 Juniper Point Ln Conroe, TX | 4.0 | 2.5 | 2242 | $2,450 | $1.09 | 18d | 1 | 0.62mi |
| 14031 Chinook Dr Conroe, TX | 4.0 | 3.5 | 2630 | $2,550 | $0.97 | 43d | 1 | 1.00mi |
| 2547 Steelhead Dr Conroe, TX | 4.0 | 2.5 | 2628 | $2,390 | $0.91 | 5d | 1 | 1.03mi |
HOA detail
- Monthly dues
- $71 · $852/yr
- Likely covers
- waterpool
Listing history 29 events
-
2026-06-18days on market $334,000 Active 121 DOM
-
2026-06-17days on market $334,000 Active 120 DOM
-
2026-06-16days on market $334,000 Active 119 DOM
-
2026-06-15days on market $334,000 Active 118 DOM
-
2026-06-13days on market $334,000 Active 116 DOM
-
2026-06-09days on market $334,000 Active 112 DOM
-
2026-06-08days on market $334,000 Active 111 DOM
-
2026-06-07days on market $334,000 Active 110 DOM
-
2026-06-04days on market $334,000 Active 107 DOM
-
2026-06-03days on market $334,000 Active 106 DOM
-
2026-06-02days on market $334,000 Active 105 DOM
-
2026-06-01pricedays on market $334,000 Active 104 DOM
-
2026-05-31days on market $349,500 Active 103 DOM
-
2026-04-01$2,600
-
2026-02-17$349,500 Active 669-char remark
Show marketing remark (669 chars)
Nestled in a quiet CUL-DE-SAC, this single-story home boasts numerous upgrades. The spacious layout includes 4 bedrooms, 2 full baths, 42” cabinets, granite countertops, stainless steel appliances, and tile flooring. Additional features include plantation blinds, front door with glass design, gutters, sprinkler system, and finished attic space. The oversized master suite offers a double sink vanity, tub, and shower. Outside, a covered patio with ceiling fans overlooking the backyard. RainSoft water system is included. Residents enjoy access to a pool, playground, and community center, all within the Woodlands Schools district. Don't let this one get away!
-
2025-10-13historical
-
2025-09-18$350,000 Active
-
2025-09-18historical
-
2025-06-17price $350,000
-
2025-06-04$360,000 Active
-
2025-06-04historical
-
2025-05-02$360,000 Active
-
2025-05-02historical
-
2020-10-14soldstatus Sold
-
2020-08-11status Pending
-
2020-08-06status Option Pending
-
2020-07-17price $250,000
-
2020-06-12price $254,000
-
2020-05-12$258,000 Active
ⓘ Source: listings_history table (triggers on properties + properties_extension) + one-shot
backfill from property_details.listing_events for pre-trigger history.
Tax reassessment forecast TX · Resets to sale price
- Current annual tax
- $4,857 · $405/mo
- Projected year-2 tax
- $6,112 · $509/mo
- Expected delta
- +$1,256/yr (+$105/mo · 25.9%)
ⓘ Screening estimate from a state-policy table — verify with the county assessor before closing.
Climate risk First Street
- Flood 1/10 Low FEMA zone X (unshaded) · 0% chance over 30 yrs
- Wildfire 4/10 Moderate
- Heat 9/10 Extreme 7 d/yr ≥112°F today · 24 d/yr by 30 yrs out
- Wind 8/10 Severe 99% chance of damaging wind over 30 yrs
- Air quality 2/10 Low 2 unhealthy d/yr today · 2 by 30 yrs out
Nearby sold comps map
Loading sold comps map…
Walkable amenities ~0.75 mi
Loading nearby amenities…
Taxation est. · year 1
- Rental income
- $29,428
- − Mortgage interest
- −$18,709
- − Property taxes
- −$4,857
- − Insurance
- −$1,670
- − Repairs & maintenance
- −$2,354
- − Management
- −$2,354
- − HOA
- −$852
- − Depreciation
- −$9,716
- Taxable loss
- −$11,084
- Est. tax savings @ 24.0%
- +$2,660
- After-tax cash flow
- $-2,488/yr
For passive investors: Depreciation is non-cash, so a rental often shows a tax loss while cash-flowing — sheltering income. Rental losses are passive: they offset passive income freely, and up to $25,000/yr can offset ordinary (W-2) income if you actively participate and your MAGI is under $100k (phasing out to $0 by $150k); unused losses carry forward. On sale, claimed depreciation is recaptured at up to 25%, and gains may owe capital-gains tax (a 1031 exchange can defer both). Figures are a year-1 estimate at your 24.0% rate — not tax advice; consult a CPA.
Schools (NCES district)
- District
- Conroe ISD
- NCES district ID
- 4815000
- Math proficiency
- 57% ▼ -6.00%
- Reading proficiency
- 57% ▼ -1.00%
- Median HH income
- $71,541
- Composite
- 50.65/100
- National rank
- #1833
- State rank
- #69 of 826 in TX
Livability — The Woodlands
- Score
- 91/100
- State rank
- #1
- US rank
- #47
Category grades
Schools grade is shown separately in the Schools card above.
Census & demographics
- County
- Montgomery County · 663,713 people
- City population
- 106,505
- Metro
- Houston-The Woodlands-Sugar Land, TX
- Population (ZIP)
- 26,781
- Household income
- $91,667
- Rent vs Own
- Severe rent burden
- 1399.0
Population outlook (Montgomery County) Hauer SSP2
- Today (2025)
- 713,896 people
- By 2030
- 805,263 · +12.8%
- By 2040
- 992,708 · +39.1%
- By 2050
- 1,179,590 · +65.2%
- By 2075
- 1,628,084 · +128.1%
- By 2100
- 1,937,880 · +171.5%
Race, ethnicity, and origin ACS 2023
- Neighborhood character
- Predominantly White (66%)
- Race & ethnicity
- White 66% Hispanic / Latino 20% Two or more races 14% Asian 6% Black 5%
- Hispanic origin (detail)
- Mexican 12%
- Common ancestry
- Lithuanian 2% Romanian 2% Italian 2%
- Foreign-born
- 17% · Canada, Jamaica, China
- Languages at home
- 79% English-only · Spanish 13% Other Indo-European 3% Other Asian/Pacific 1%
Political lean MEDSL · Montgomery
- 2024 margin
- Solid R (+45.5) · D 26.8% · R 72.3%
- 2008→2024 swing
- +7.2pp toward D · 2008: -52.7pp · 2024: -45.5pp
- All cycles
- 2024: R+45.5 2020: R+43.8 2016: R+51.4 2012: R+60.7 2008: R+52.7
Not yet ingested
- Civics
- —
Market trends
- HPI YoY
- ▼ -64.42%
- Current HPI
- 220.403
- Rent YoY
- ▲ 0.44%
- Metro
- Houston-The Woodlands-Sugar Land, TX
- State GDP YoY
- ▲ 3.95%
- F500 in state
- 110
Industry mix (Fortune 500 HQ in TX)
| Industry | F500 HQs | Revenue |
|---|---|---|
| Energy | 16 | $1,198B |
|
||
| Technology | 5 | $198B |
|
||
| Engineering / Construction | 4 | $72B |
|
||
| Energy Services | 3 | $60B |
|
||
| Utilities | 3 | $41B |
|
||
| Healthcare | 2 | $330B |
|
||
Price history
-99.0% since first listed16 events — show timeline
- 2026-04-01 Listed for Rent $2,600 HARMLS
- 2026-02-17 Listed $349,500 HARMLS
- 2025-10-13 Listing Removed — HARMLS
- 2025-09-18 Listing Removed — HARMLS
- 2025-09-18 Listed $350,000 HARMLS
- 2025-06-17 Price Changed $350,000 HARMLS
- 2025-06-04 Listing Removed — HARMLS
- 2025-06-04 Listed $360,000 HARMLS
- 2025-05-02 Listed $360,000 HARMLS
- 2025-05-02 Coming Soon — HARMLS
- 2020-10-14 Sold (MLS) — HARMLS
- 2020-08-11 Pending — HARMLS
- 2020-08-06 Pending — HARMLS
- 2020-07-17 Price Changed $250,000 HARMLS
- 2020-06-12 Price Changed $254,000 HARMLS
- 2020-05-12 Listed $258,000 HARMLS
Property tax history
+21.4%/yrLatest (2024): $4,857 · -48.5% YoY. Source: county tax records.
Cash-flow waterfall
monthlySold comps — $/sqft
last 12 mo · ≤1 miLoading sold comps…