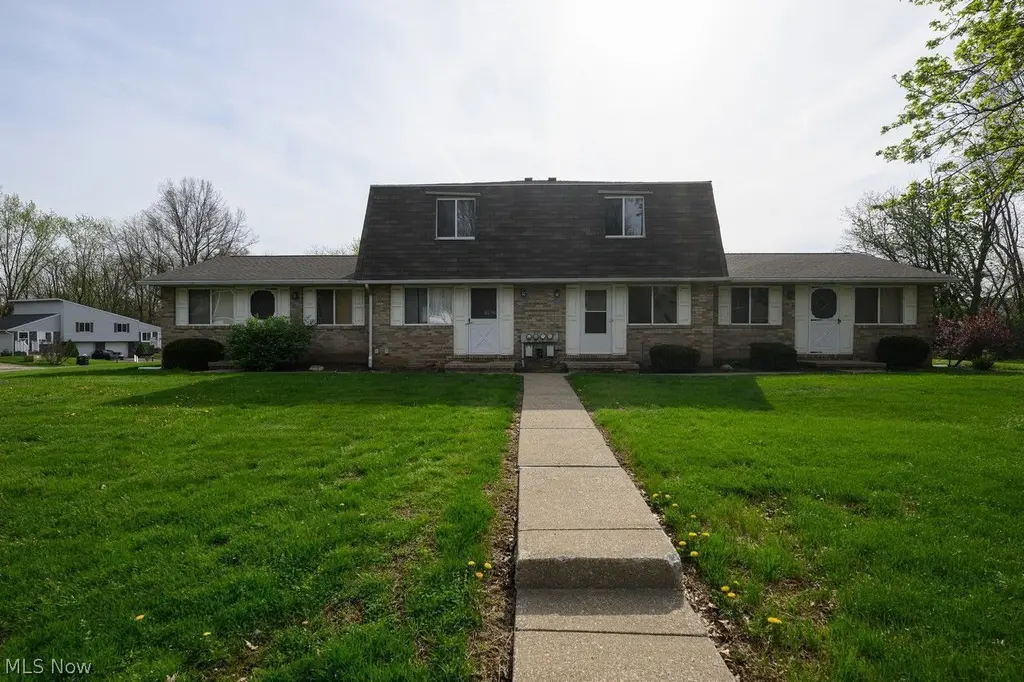
320 Harding Ave NW
Perry Heights, OH 44646
$395,000F
6 bd · 4.0 ba ·
768 sqft ·
Built 1979
· MultiFamily
· Pending
· 14 DOM
Cashflow @ list (25.0% down · 7.5%)
Estimated rent
$2,094/mo
Mortgage (P&I)
−$2,071
Tax + insurance
−$258
HOA
−$0
Vac / Maint / Mgmt
−$440
Net cashflow
$-676/mo
Annual
$-8,107/yr
Cap rate
4.24%
Cash-on-cash
-7.33%
DSCR
0.67
1% rule
0.53%
Cash to close
$110,600
Investor read
- This is a 2 × 3-bed/2.0-bath units multifamily listed at $395k.
- At list price, monthly cash flow is $-676 ($-8k/yr) — negative. Per door: $-338/mo.
- To cash-flow at today's rent, offer at most $276k (30.2% below list).
- To meet the 1% rule (rent ≥ 1% of price), the offer needs to be $209k (47.0% below list).
- Only 14 days on market — expect competitive offers; lowballing is unlikely to land.
- Recommended offer: $209k (47.0% below list) — sets the bar for 1% rule.
- Local home prices are declining (-3.0%/yr); year-one equity from $3k of loan paydown is wiped out by about $12k of value loss. Plan a longer hold.
- Location reads 68/100 on livability (#575 in OH) — a middle-class / working-renter tenant base. Strengths: cost of living A+, housing A+; Watch: amenities F, commute F, health & safety F.
- Perry Local (suburban): math 63% / reading 73% proficiency, ranked #173 of 656 in OH (top 26%) — acceptable for families but not a draw, mixed tenant base, ~2y average lease.
- Zoned schools: T C Knapp Elementary School (math 82% / reading 72%, grade A, #221 of 1,584 statewide, top 16%, 416 students, 24% FRL); Edison Middle School (math 61% / reading 75%, grade A-, #155 of 654 statewide, top 24%, 689 students, 37% FRL); Perry High School (math 36% / reading 72%, grade C-, #331 of 781 statewide, top 43%, 1,478 students, 30% FRL) — zoned schools at 30% FRL track the district average.
- Market conditions: Rents rising fast (+6.0%/yr); 212 active listings in the ZIP; 528 units permitted in Stark County in 2024 (84 in 5+ unit buildings).
- Stark County population projected to shrink 8% by 2050 — rents likely to lag national; underwrite the cash flow, not the appreciation.
- Cap rate 4.2% vs local median 2.7% in Perry Heights — top-decile yield for the area; either an underpriced asset or a hidden risk that comps aren't pricing in. Stress-test before assuming the spread holds.
- This rent runs 36% of the median local income ($69k/yr) — at the standard rent-burdened threshold; future hikes will face affordability resistance.
Questions for listing agent
- What do current leases actually rent for vs. the listed asking? Can we see a recent rent roll and the last 12 months of T-12 income?
- Can we see the unit-by-unit rent roll, current vacancy, and any below-market leases? What's the average tenancy length?
- What capital expenditures (roof, boiler, parking lot, exteriors) have been made in the last 5 years, and what's planned in the next 2?
- Built in 1979 — when were the roof, HVAC, electrical panel, plumbing, and water heater last replaced?
- Is there a deadline driving the sale (1031 exchange, divorce, estate, relocation)? That informs how much negotiation room exists.
- The area grade is low — what's the realistic commute time and amenity access for the typical tenant pool here? Any planned neighborhood developments (good or bad) we should know about?
- What's the average days-on-market for RENTAL listings here right now (not sales)? A rising rental-DOM trend means longer vacancies and softer asking-rent achievability than the comps imply.
- What's the recent tenant-quality profile in this submarket — average credit score on applications, eviction rate, late-payment / NSF rate, and stable-employment percentage? A property-management company in the area should have these aggregated.
CashFlowRE · CFR-8RX08T4VWNET32
· Data 1 week ago
cashflowre.app · 2026-05-29