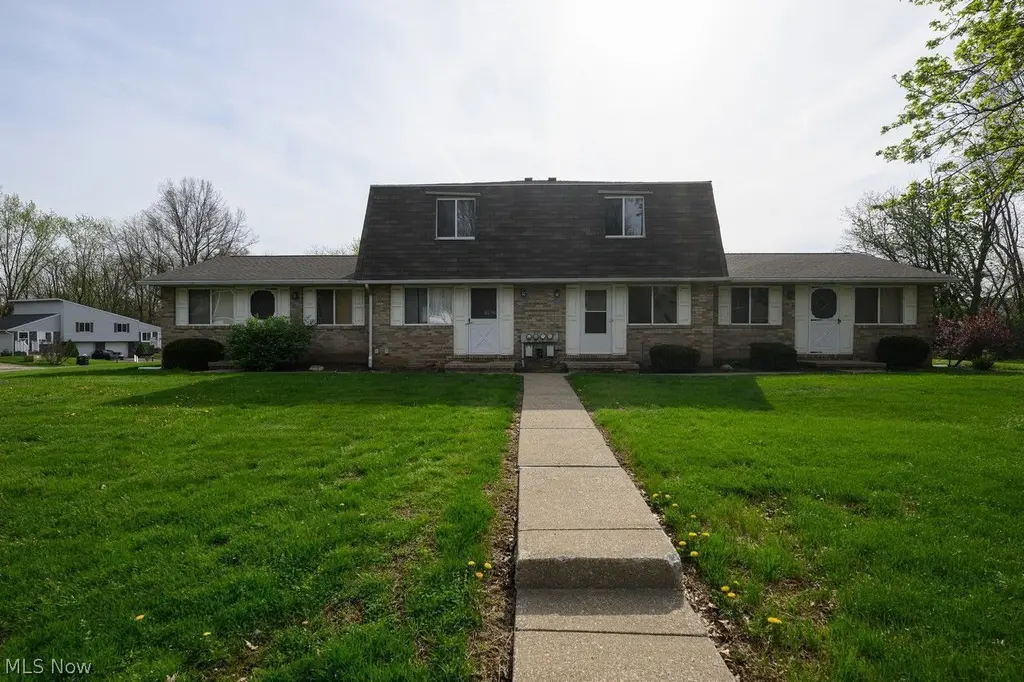
 Duplex
320 Harding Ave NW · Perry Heights, OH
Flood risk 1/10 · Minimal
- FEMA flood zone
- X (unshaded)
- Chance of flooding over 30 yrs
- 0.0%
- Est. flood insurance / yr
- $507 – $1,088
Fire risk 1/10 · Minimal
- Est. fire insurance / yr
- $713 – $1,323
Heat risk 3/10 · Minor
- Hot days now (above 96°F)
- 7 days/yr
- Hot days in 30 yrs
- 17 days/yr
Wind risk 1/10 · Minimal
- Chance of severe wind over 30 yrs
- —
Air-quality risk 2/10 · Minimal
- Unhealthy air days now
- 0 days/yr
- Unhealthy air days in 30 yrs
- 1 days/yr
Risk factors via First Street. Map © Google.
Why this score? — see what drove the F grade
The composite is a weighted blend of 9 inputs, each scored 0–100. Each bar is that input's sub-score; the figure is the points it added to the 100-point composite (weight × sub-score).
- ARV discount +7.5/15.0
- Cash flow +6.5/30.0
- Schools +5.8/10.0
- Rent growth +4.0/5.0
- Livability +3.4/5.0
- Condition / age +2.5/5.0
- DSCR +0.7/10.0
- 1% rule +0.3/10.0
- Appreciation +0.0/10.0
$395,000
🖨 Deal sheet (PDF) 📄 Offer letter ✓ Due diligence
Multi-family units
County records classify this as Multi-Family (5+ Unit). Listing-text estimate: 2 units. estimate disagrees with records
5+ unit building — per-unit beds/baths from public records are typically unavailable; the breakdown below (if shown) is an estimate from the listing text.
Listing remarks
Two units are two-bedroom, one bath, townhome style with basements. These units have eat-in kitchens with sliders to a patio. The two end units are one bedroom ranch units. All units have private entrances and patios. Plenty of parking. Great location near schools, restaurants, and shopping!
Key facts
- Eat-in kitchens
- Great location
- Private entrances
Tags
Neighborhood map
What this means for you Summary
Snapshot
- This is a 2 × 3-bed/2.0-bath units multifamily listed at $395k.
Deal economics
- At list price, monthly cash flow is $-676 ($-8k/yr) — negative. Per door: $-338/mo.
- To cash-flow at today's rent, offer at most $276k (30.2% below list).
- To meet the 1% rule (rent ≥ 1% of price), the offer needs to be $209k (47.0% below list).
- Recommended offer: $209k (47.0% below list) — sets the bar for 1% rule.
- Cap rate 4.2% vs local median 2.7% in Perry Heights — top-decile yield for the area; either an underpriced asset or a hidden risk that comps aren't pricing in. Stress-test before assuming the spread holds.
Location & tenants
- Location reads 68/100 on livability (#575 in OH) — a middle-class / working-renter tenant base. Strengths: cost of living A+, housing A+; Watch: amenities F, commute F, health & safety F.
- Perry Local (suburban): math 63% / reading 73% proficiency, ranked #173 of 656 in OH (top 26%) — acceptable for families but not a draw, mixed tenant base, ~2y average lease.
- Zoned schools: T C Knapp Elementary School (math 82% / reading 72%, grade A, #221 of 1,584 statewide, top 16%, 416 students, 24% FRL); Edison Middle School (math 61% / reading 75%, grade A-, #155 of 654 statewide, top 24%, 689 students, 37% FRL); Perry High School (math 36% / reading 72%, grade C-, #331 of 781 statewide, top 43%, 1,478 students, 30% FRL) — zoned schools at 30% FRL track the district average.
- Market conditions: Rents rising fast (+6.0%/yr); 212 active listings in the ZIP; 528 units permitted in Stark County in 2024 (84 in 5+ unit buildings).
- This rent runs 36% of the median local income ($69k/yr) — at the standard rent-burdened threshold; future hikes will face affordability resistance.
Forward outlook
- Local home prices are declining (-3.0%/yr); year-one equity from $3k of loan paydown is wiped out by about $12k of value loss. Plan a longer hold.
- Stark County population projected to shrink 8% by 2050 — rents likely to lag national; underwrite the cash flow, not the appreciation.
Negotiation context
- Only 14 days on market — expect competitive offers; lowballing is unlikely to land.
Questions for the listing agent
- What do current leases actually rent for vs. the listed asking? Can we see a recent rent roll and the last 12 months of T-12 income?
- Can we see the unit-by-unit rent roll, current vacancy, and any below-market leases? What's the average tenancy length?
- What capital expenditures (roof, boiler, parking lot, exteriors) have been made in the last 5 years, and what's planned in the next 2?
- Built in 1979 — when were the roof, HVAC, electrical panel, plumbing, and water heater last replaced?
- Is there a deadline driving the sale (1031 exchange, divorce, estate, relocation)? That informs how much negotiation room exists.
- The area grade is low — what's the realistic commute time and amenity access for the typical tenant pool here? Any planned neighborhood developments (good or bad) we should know about?
- What's the average days-on-market for RENTAL listings here right now (not sales)? A rising rental-DOM trend means longer vacancies and softer asking-rent achievability than the comps imply.
- What's the recent tenant-quality profile in this submarket — average credit score on applications, eviction rate, late-payment / NSF rate, and stable-employment percentage? A property-management company in the area should have these aggregated.
- How much new apartment / multifamily construction is in the pipeline within 1–3 miles? Heavy new supply (>2% of stock underway) typically softens rents 12–24 months out; light construction supports rent growth.
Investment metrics
- 1% rule
- 0.53% ✗
- Cap rate
- 4.24%
- Cash-on-cash
- -7.33%
- DSCR
- 0.67
- GRM
- 15.7
CMA / ARV
No comps found within radius.
Projected returns pro-forma
-3.0% appreciation · 6.04% rent growth · sell at horizon
- IRR
- -26.5%
- Equity multiple
- 0.09×
- Total profit
- $-100,651
- Equity at exit
- $58,896
- IRR
- -17.1%
- Equity multiple
- -0.04×
- Total profit
- $-115,095
- Equity at exit
- $34,152
Cash invested: $110,600 (down + closing). Projections, not guarantees.
Landlord ↔ Tenant lean methodology
- Overall (STATE)
- 73 Landlord-Friendly
- State Ohio
- 73 Landlord-Friendly · R+6
- County
- — inherits STATE
- City
- — inherits STATE
ZIP-level market 44646
- Rents YoY
- 6.0%
- Active inventory
- 212
- Price-to-rent
- 31.4×
Monthly cashflow live
- Estimated rent
- $2,094 medium interval (Pro) →
- Mortgage (P&I)
- −$2,071
- Tax from tax record
- −$94 /mo · $1,126/yr
- Insurance
- −$165
- HOA
- −$0
- Vacancy / Maint / Mgmt
- −$440
- Net cashflow
- $-676
Break-even live
Sensitivity live
| Price | -10% $-452 | -5% $-564 | +0% $-676 | +5% $-787 | +10% $-899 |
|---|---|---|---|---|---|
| Rent | -10% $-841 | -5% $-758 | +0% $-676 | +5% $-593 | +10% $-510 |
| Rate | -1.0pp $-477 | -0.5pp $-575 | base $-676 | +0.5pp $-778 | +1.0pp $-882 |
2-unit breakdown (identical units grouped — click to expand)
| Units | Beds | Baths | Est. rent |
|---|---|---|---|
| 2× units | 3 | 2 | $2,094 |
| #1 | 3 | 2 | $1,047 |
| #2 | 3 | 2 | $1,047 |
| Total (2 units) | $2,094 | ||
UW: 25.0% down · 7.5% · 30yr · 1.5% tax · 5.0% vac · 8.0% maint · 8.0% mgmt
Financing live
Cash to close
- Down payment
- $98,750
- Closing costs
- $11,850
- Reserves months
- —
- Total cash needed
- —
Loan-product check · same deal, 3 products live
Conventional
25% down · 7.5% · 30yr
- Down + closing
- —
- Monthly P&I
- —
- Monthly cashflow
- —
- DSCR
- —
- Eligible?
- —
Personal DTI + credit; lowest rate.
DSCR
20% down · 8.5% · 30yr
- Down + closing
- —
- Monthly P&I
- —
- Monthly cashflow
- —
- DSCR
- —
- Eligible?
- —
No personal income docs; deal must DSCR.
Hard money
10% down · 12.0% · 12mo
- Down + closing
- —
- Monthly P&I
- —
- Monthly cashflow
- —
- DSCR
- —
- Eligible?
- —
Short-term bridge; refi at stabilization.
Listing history 2 events
-
2026-06-08remarks 292-char remark
-
2026-06-08$395,000 Pending 14 DOM
ⓘ Source: listings_history table (triggers on properties + properties_extension) + one-shot
backfill from property_details.listing_events for pre-trigger history.
Tax reassessment forecast OH · Partial reset (capped growth)
- Current annual tax
- $1,126 · $94/mo
- Projected year-2 tax
- $3,644 · $304/mo
- Expected delta
- +$2,518/yr (+$210/mo · 223.6%)
ⓘ Screening estimate from a state-policy table — verify with the county assessor before closing.
Climate risk First Street
- Flood 1/10 Low FEMA zone X (unshaded) · 0% chance over 30 yrs
- Wildfire 1/10 Low
- Heat 3/10 Moderate 7 d/yr ≥96°F today · 17 d/yr by 30 yrs out
- Wind 1/10 Low
- Air quality 2/10 Low 0 unhealthy d/yr today · 1 by 30 yrs out
Nearby sold comps map
Loading sold comps map…
Walkable amenities ~0.75 mi
Loading nearby amenities…
Taxation est. · year 1
- Rental income
- $25,128
- − Mortgage interest
- −$22,126
- − Property taxes
- −$1,126
- − Insurance
- −$1,975
- − Repairs & maintenance
- −$2,010
- − Management
- −$2,010
- − Depreciation
- −$11,491
- Taxable loss
- −$15,611
- Est. tax savings @ 24.0%
- +$3,747
- After-tax cash flow
- $-4,361/yr
For passive investors: Depreciation is non-cash, so a rental often shows a tax loss while cash-flowing — sheltering income. Rental losses are passive: they offset passive income freely, and up to $25,000/yr can offset ordinary (W-2) income if you actively participate and your MAGI is under $100k (phasing out to $0 by $150k); unused losses carry forward. On sale, claimed depreciation is recaptured at up to 25%, and gains may owe capital-gains tax (a 1031 exchange can defer both). Figures are a year-1 estimate at your 24.0% rate — not tax advice; consult a CPA.
Schools (NCES district)
- District
- Perry Local
- NCES district ID
- 3904992
- Math proficiency
- 63% ▼ -10.00%
- Reading proficiency
- 73% ▼ -4.00%
- Median HH income
- $51,700
- Composite
- 57.83/100
- National rank
- #1048
- State rank
- #173 of 656 in OH
Livability — Perry Heights
- Score
- 68/100
- State rank
- #575
- US rank
- #9817
Category grades
Schools grade is shown separately in the Schools card above.
Census & demographics
- Census place
- Perry Heights, OH
- County
- Stark County · 272,865 people
- Metro
- Canton-Massillon, OH
- Population (ZIP)
- 47,741
- Household income
- $69,179
- Rent vs Own
- Severe rent burden
- 1011.0
Population outlook (Stark County) Hauer SSP2
- Today (2025)
- 373,708 people
- By 2030
- 371,245 · -0.7%
- By 2040
- 361,331 · -3.3%
- By 2050
- 345,290 · -7.6%
- By 2075
- 302,669 · -19.0%
- By 2100
- 238,870 · -36.1%
Race, ethnicity, and origin ACS 2023
- Neighborhood character
- Predominantly White (86%)
- Race & ethnicity
- White 86% Black 7% Two or more races 5% Hispanic / Latino 3% Asian 1%
- Common ancestry
- Lithuanian 3% Romanian 2% Scandinavian 2%
- Foreign-born
- 2% · Canada, China
- Languages at home
- 97% English-only · Spanish 1% Other Indo-European 1%
Political lean MEDSL · Stark
- 2024 margin
- Strong R (+21.9) · D 38.6% · R 60.5%
- 2008→2024 swing
- -27.4pp toward R · 2008: 5.5pp · 2024: -21.9pp
- All cycles
- 2024: R+21.9 2020: R+18.5 2016: R+17.4 2012: R+0.4 2008: D+5.5
Not yet ingested
- Civics
- —
Market trends
- HPI YoY
- ▼ -190.31%
- Current HPI
- 217.8955
- Rent YoY
- ▲ 6.04%
- Metro
- Canton-Massillon, OH
- State GDP YoY
- ▲ 1.98%
- F500 in state
- 48
Industry mix (Fortune 500 HQ in OH)
| Industry | F500 HQs | Revenue |
|---|---|---|
| Insurance | 3 | $145B |
|
||
| Industrial Machinery | 3 | $49B |
|
||
| Financial Services | 3 | $24B |
|
||
| Consumer Goods | 2 | $93B |
|
||
| Aerospace / Defense | 2 | $47B |
|
||
| Utilities | 2 | $33B |
|
||
Price history
2 events — show timeline
- 2026-05-04 Pending — MLSNOW
- 2026-04-20 Listed $395,000 MLSNOW
Property tax history
-5.0%/yrLatest (2024): $1,126 · -35.7% YoY. Source: county tax records.
Cash-flow waterfall
monthlySold comps — $/sqft
last 12 mo · ≤1 miLoading sold comps…