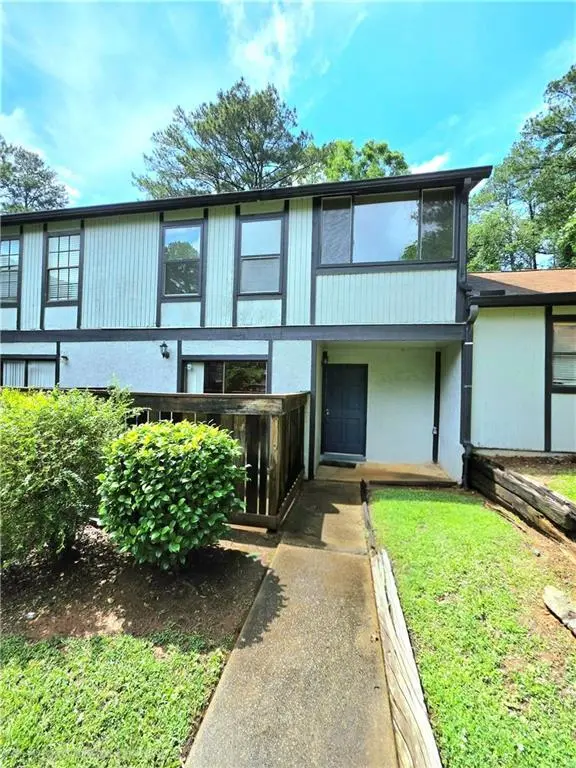
1453 Stone Mill Trce
Tucker, GA 30083
$69,900B-
3 bd · 1.5 ba ·
1,152 sqft ·
Built 1974
· Condo
· Active
· 4 DOM
Cashflow @ list (25.0% down · 7.5%)
Estimated rent
$1,616/mo
Mortgage (P&I)
−$367
Tax + insurance
−$258
HOA
−$420
Vac / Maint / Mgmt
−$339
Net cashflow
$232/mo
Annual
$2,783/yr
Cap rate
10.27%
Cash-on-cash
14.22%
DSCR
1.63
1% rule
2.31%
Cash to close
$19,572
Investor read
- This is a 3-bed/1.5-bath condo listed at $70k.
- At list price, monthly cash flow is $232 ($3k/yr) — positive.
- The deal already cash-flows at list — no discount required.
- Meets the 1% rule at list price ($2k rent vs $70k).
- Only 4 days on market — expect competitive offers; lowballing is unlikely to land.
- Local home prices are declining (-3.0%/yr); year-one equity from $483 of loan paydown is wiped out by about $2k of value loss. Plan a longer hold.
- Location reads: area grade B — affects rentability + tenant quality, not the cash-flow math above.
- Dekalb County (suburban): math 19% / reading 28% proficiency, ranked #125 of 174 in GA (top 72%) — low school quality limits family demand, transient renter base, plan for 1-2y turnover; 68% free/reduced lunch — lower-income household profile, screen leases tightly.
- Zoned schools: Stone Mountain Elementary School (math 2% / reading 8%, grade F, #1,160 of 1,228 statewide, top 98%, 450 students, 100% FRL); Stone Mountain Middle School (math 12% / reading 15%, grade F, #407 of 470 statewide, top 87%, 1,072 students, 100% FRL); Stone Mountain High School (math 8% / reading 12%, grade F, #365 of 424 statewide, top 88%, 1,202 students, 100% FRL) — zoned schools average 100% FRL vs 68% district-wide (32 pts higher); higher-poverty schools than district average — tighter screening recommended.
- Zoned-school proficiency averages 9% at this address vs 24% district-wide (-14 pts) — the specific schools serving this property underperform the Dekalb County average; the district grade overstates school quality for this exact location.
- Watch-outs: property tax is 3.9% of price; HOA is 26% of rent.
- Market conditions: Rents rising (+1.3%/yr); 257 active listings in the ZIP; 29 comparable units currently listed for rent nearby; rentals at typical pace (median 15d on market — plan ~3-4 weeks tenant-placement turnaround); 1,240 units permitted in DeKalb County in 2024 (385 in 5+ unit buildings).
- DeKalb County population projected at +28% by 2050 — long-run rental-demand tailwind backs the buy-and-hold thesis.
- 11 sale attempts since 12y ago with the ask held roughly flat each time — persistent listings suggest the price (not the market) is what's stuck; bring a comps-based counter.
- Climate carrying-cost: moderate wind risk, 23% chance of damaging wind over 30y; extreme-heat days projected 7→18/yr by 2055 (HVAC capex compounding) — expect insurance premiums to compound above CPI over the hold.
- Cap rate 10.3% vs local median 3.4% in Tucker — top-decile yield for the area; either an underpriced asset or a hidden risk that comps aren't pricing in. Stress-test before assuming the spread holds.
- This rent runs 35% of the median local income ($55k/yr) — at the standard rent-burdened threshold; future hikes will face affordability resistance.
Questions for listing agent
- Built in 1974 — when were the roof, HVAC, electrical panel, plumbing, and water heater last replaced?
- Property tax is high relative to price — has the assessment been appealed recently, and will the sale trigger a re-assessment?
- What does the HOA fee cover, when was the last increase, and are there any pending special assessments or reserve-fund shortfalls?
- Any open or pending special assessments — roof, HVAC, plumbing, elevator, façade? What's the per-unit balance and payoff schedule, and is the seller paying it off at close or rolling it to the buyer?
- Is there a deadline driving the sale (1031 exchange, divorce, estate, relocation)? That informs how much negotiation room exists.
- What's the average days-on-market for RENTAL listings here right now (not sales)? A rising rental-DOM trend means longer vacancies and softer asking-rent achievability than the comps imply.
- What's the recent tenant-quality profile in this submarket — average credit score on applications, eviction rate, late-payment / NSF rate, and stable-employment percentage? A property-management company in the area should have these aggregated.
- How much new apartment / multifamily construction is in the pipeline within 1–3 miles? Heavy new supply (>2% of stock underway) typically softens rents 12–24 months out; light construction supports rent growth.
CashFlowRE · CFR-8T2JH683R16QCD
· Data 2 weeks ago
cashflowre.app · 2026-05-29