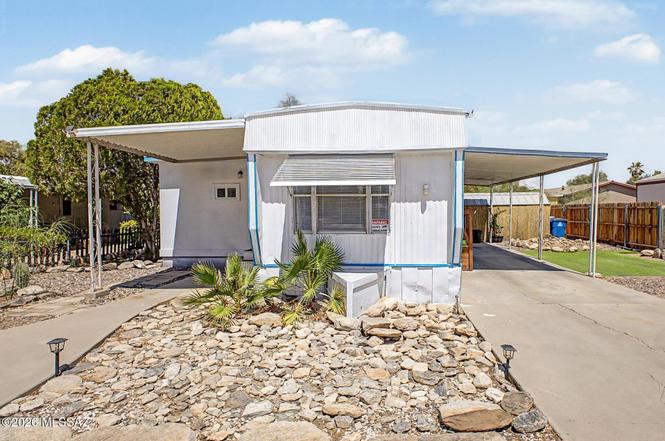
6330 N Orange Blossom Ln
Casas Adobes, AZ 85741
$198,500D
4 bd · 2.5 ba ·
360 sqft ·
Built 1976
· Manufactured
· Active
· 3 DOM
Cashflow @ list (25.0% down · 7.5%)
Estimated rent
$1,641/mo
Mortgage (P&I)
−$1,041
Tax + insurance
−$164
HOA
−$72
Vac / Maint / Mgmt
−$345
Net cashflow
$20/mo
Annual
$237/yr
Cap rate
6.41%
Cash-on-cash
0.43%
DSCR
1.02
1% rule
0.83%
Cash to close
$55,580
Investor read
- This is a 4-bed/2.5-bath manufactured listed at $198k.
- At list price, monthly cash flow is $20 ($237/yr) — positive.
- The deal already cash-flows at list — no discount required.
- To meet the 1% rule (rent ≥ 1% of price), the offer needs to be $164k (17.3% below list).
- Only 3 days on market — expect competitive offers; lowballing is unlikely to land.
- Recommended offer: $164k (17.3% below list) — sets the bar for 1% rule.
- Local home prices are declining (-3.0%/yr); year-one equity from $1k of loan paydown is wiped out by about $6k of value loss. Plan a longer hold.
- Location reads 79/100 on livability (#8 in AZ, #2,353 nationally) — a middle-class / working-renter tenant base. Strengths: housing A+, health & safety A, employment B+; Watch: amenities D.
- Flowing Wells Unified District (4405) (suburban): math 23% / reading 30% proficiency, ranked #143 of 249 in AZ (top 57%) — low school quality limits family demand, transient renter base, plan for 1-2y turnover; 64% free/reduced lunch — lower-income household profile, screen leases tightly.
- Zoned schools: J Robert Hendricks Elementary School (math 43% / reading 46%, grade F, #339 of 1,109 statewide, top 32%, 469 students, 61% FRL); Flowing Wells Junior High School (math 24% / reading 28%, grade F, #100 of 218 statewide, top 47%, 818 students, 74% FRL); Flowing Wells High School (math 22% / reading 24%, grade F, #208 of 381 statewide, top 55%, 1,694 students, 65% FRL) — zoned schools at 66% FRL track the district average.
- Market conditions: Rents rising (+1.9%/yr); 92 active listings in the ZIP; solid renter incomes; 5,268 units permitted in Pima County in 2024 (996 in 5+ unit buildings).
- Pima County population projected at +8% by 2050 — modest demand growth; plan on rents tracking national, not racing it.
- 6 sale attempts since 8y ago with the ask held roughly flat each time — persistent listings suggest the price (not the market) is what's stuck; bring a comps-based counter.
- Current owner paid $134k; 48% above their basis — modest negotiation headroom, anchor on the comps not their cost.
- Climate carrying-cost: moderate wildfire risk; extreme-heat days projected 6→16/yr by 2055 (HVAC capex compounding) — expect insurance premiums to compound above CPI over the hold.
- Cap rate 6.4% vs local median 3.5% in Casas Adobes — top-decile yield for the area; either an underpriced asset or a hidden risk that comps aren't pricing in. Stress-test before assuming the spread holds.
Questions for listing agent
- Built in 1976 — when were the roof, HVAC, electrical panel, plumbing, and water heater last replaced?
- What does the HOA fee cover, when was the last increase, and are there any pending special assessments or reserve-fund shortfalls?
- Is there a deadline driving the sale (1031 exchange, divorce, estate, relocation)? That informs how much negotiation room exists.
- The area grade is low — what's the realistic commute time and amenity access for the typical tenant pool here? Any planned neighborhood developments (good or bad) we should know about?
- What's the average days-on-market for RENTAL listings here right now (not sales)? A rising rental-DOM trend means longer vacancies and softer asking-rent achievability than the comps imply.
- What's the recent tenant-quality profile in this submarket — average credit score on applications, eviction rate, late-payment / NSF rate, and stable-employment percentage? A property-management company in the area should have these aggregated.
- How much new for-sale + rental construction is in the pipeline within 1–3 miles? Heavy new supply typically softens prices + rents 12–24 months out; constrained supply supports both.
CashFlowRE · CFR-8T63VX4413GVWH
· Data 2 days ago
cashflowre.app · 2026-05-29