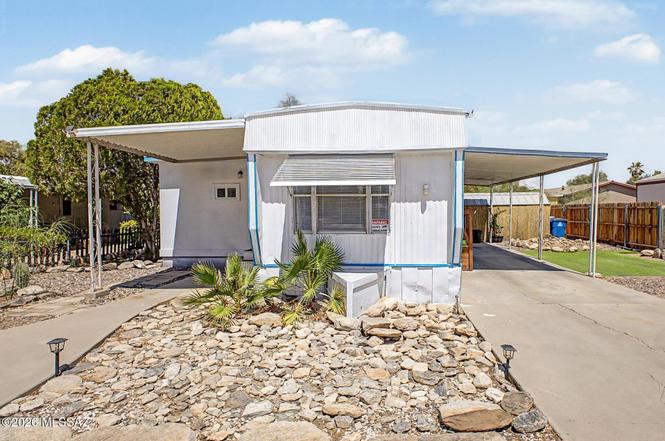
6330 N Orange Blossom Ln · Casas Adobes, AZ
Flood risk 4/10 · Minor
- FEMA flood zone
- X (shaded)
- Chance of flooding over 30 yrs
- 0.22%
- Est. flood insurance / yr
- $507 – $1,088
Fire risk 5/10 · Moderate
- Est. fire insurance / yr
- $610 – $1,132
Heat risk 8/10 · Major
- Hot days now (above 107°F)
- 6 days/yr
- Hot days in 30 yrs
- 16 days/yr
Wind risk 1/10 · Minimal
- Chance of severe wind over 30 yrs
- —
Air-quality risk 1/10 · Minimal
- Unhealthy air days now
- 0 days/yr
- Unhealthy air days in 30 yrs
- 0 days/yr
Risk factors via First Street. Map © Google.
Why this score? — see what drove the D grade
The composite is a weighted blend of 9 inputs, each scored 0–100. Each bar is that input's sub-score; the figure is the points it added to the 100-point composite (weight × sub-score).
- Cash flow +13.8/30.0
- ARV discount +7.5/15.0
- DSCR +4.2/10.0
- Livability +4.0/5.0
- 1% rule +3.3/10.0
- Rent growth +3.0/5.0
- Condition / age +2.5/5.0
- Schools +2.2/10.0
- Appreciation +0.0/10.0
$198,500
🖨 Deal sheet 📄 Offer letter ✓ Due diligence
Listing remarks MLS
This home is move-in ready. The floor plan includes 4BR/2.5BA with 1104 sq ft of living space. From the side entrance, you step into a compact , efficient kitchen that opens to a living area with four bedrooms located throughout the home. Located in the rear of the home is a spacious storage area , perfect for keeping extra belongings organized. The lot features a covered carport with more storage and an open space to create your own backyard. Come by today and see the potential this home offers. Prime location just minutes from shopping, restaurants and major freeway. Enjoy community amenities including a swimming pool, playground and clubhouse.
Key facts
- New mailbox
- Fencing
- New shower fixtures
Tags
Property features AI
Finance
- Other: Lot dimensions approximately 103' x 51' x 103' x 51'; Lot size ~5,192 sq ft; Zoned Pima County - TH; Road maintained by city; Directions: River Road and Orange Grove, East on Orange Grove, South on Orange Blossom to property
- HOA & community: Homeowners association with quarterly fee ($72/month equivalent quarterly); Community clubhouse; Community pool; Community spa/hot tub; Blanket insurance policy and common area maintenance included in association fees
Exterior
- Parking: Detached covered carport (1 covered space, 1 carport space)
- Utilities: Public water; Sewer connected
- Home design: Manufactured home; One story; Fronting east/west
- Construction: Metal siding and siding exterior; Metal roof; Built on foundation compatible with manufactured homes
- Exterior features: Chain link fencing; Paved street; Subdivided lot; East/West exposure; Has spa
Interior
- Kitchen: Gas range; Microwave
- Flooring: Carpet; Laminate
- Bathrooms: 2 full bathrooms; 1 half bathroom (3 total bathrooms)
- Heating & cooling: Heating present; Cooling present; Wall units; Window units
- Interior features: Gas range; Microwave
- Laundry & utility: Laundry closet
Neighborhood map
What this means for you Summary
Snapshot
- This is a 4-bed/2.5-bath manufactured listed at $198k.
Deal economics
- At list price, monthly cash flow is $20 ($237/yr) — positive.
- The deal already cash-flows at list — no discount required.
- To meet the 1% rule (rent ≥ 1% of price), the offer needs to be $164k (17.3% below list).
- Recommended offer: $164k (17.3% below list) — sets the bar for 1% rule.
- Cap rate 6.4% vs local median 3.5% in Casas Adobes — top-decile yield for the area; either an underpriced asset or a hidden risk that comps aren't pricing in. Stress-test before assuming the spread holds.
Location & tenants
- Location reads 79/100 on livability (#8 in AZ, #2,353 nationally) — a middle-class / working-renter tenant base. Strengths: housing A+, health & safety A, employment B+; Watch: amenities D.
- Flowing Wells Unified District (4405) (suburban): math 23% / reading 30% proficiency, ranked #143 of 249 in AZ (top 57%) — low school quality limits family demand, transient renter base, plan for 1-2y turnover; 64% free/reduced lunch — lower-income household profile, screen leases tightly.
- Zoned schools: J Robert Hendricks Elementary School (math 43% / reading 46%, grade F, #339 of 1,109 statewide, top 32%, 469 students, 61% FRL); Flowing Wells Junior High School (math 24% / reading 28%, grade F, #100 of 218 statewide, top 47%, 818 students, 74% FRL); Flowing Wells High School (math 22% / reading 24%, grade F, #208 of 381 statewide, top 55%, 1,694 students, 65% FRL) — zoned schools at 66% FRL track the district average.
- Market conditions: Rents rising (+1.9%/yr); 92 active listings in the ZIP; solid renter incomes; 5,268 units permitted in Pima County in 2024 (996 in 5+ unit buildings).
Forward outlook
- Local home prices are declining (-3.0%/yr); year-one equity from $1k of loan paydown is wiped out by about $6k of value loss. Plan a longer hold.
- Pima County population projected at +8% by 2050 — modest demand growth; plan on rents tracking national, not racing it.
Negotiation context
- Only 3 days on market — expect competitive offers; lowballing is unlikely to land.
- 6 sale attempts since 8y ago with the ask held roughly flat each time — persistent listings suggest the price (not the market) is what's stuck; bring a comps-based counter.
- Current owner paid $134k; 48% above their basis — modest negotiation headroom, anchor on the comps not their cost.
Risks & watch-outs
- Climate carrying-cost: moderate wildfire risk; extreme-heat days projected 6→16/yr by 2055 (HVAC capex compounding) — expect insurance premiums to compound above CPI over the hold.
Questions for the listing agent
- Built in 1976 — when were the roof, HVAC, electrical panel, plumbing, and water heater last replaced?
- What does the HOA fee cover, when was the last increase, and are there any pending special assessments or reserve-fund shortfalls?
- Is there a deadline driving the sale (1031 exchange, divorce, estate, relocation)? That informs how much negotiation room exists.
- The area grade is low — what's the realistic commute time and amenity access for the typical tenant pool here? Any planned neighborhood developments (good or bad) we should know about?
- What's the average days-on-market for RENTAL listings here right now (not sales)? A rising rental-DOM trend means longer vacancies and softer asking-rent achievability than the comps imply.
- What's the recent tenant-quality profile in this submarket — average credit score on applications, eviction rate, late-payment / NSF rate, and stable-employment percentage? A property-management company in the area should have these aggregated.
- How much new for-sale + rental construction is in the pipeline within 1–3 miles? Heavy new supply typically softens prices + rents 12–24 months out; constrained supply supports both.
Investment metrics
- 1% rule
- 0.83% ✗
- Cap rate
- 6.41%
- Cash-on-cash
- 0.43%
- DSCR
- 1.02
- GRM
- 10.1
CMA / ARV
No comps found within radius.
Projected returns pro-forma
-3.0% appreciation · 1.88% rent growth · sell at horizon
- IRR
- -16.8%
- Equity multiple
- 0.41×
- Total profit
- $-32,773
- Equity at exit
- $29,597
- IRR
- -10.7%
- Equity multiple
- 0.38×
- Total profit
- $-34,396
- Equity at exit
- $17,163
Cash invested: $55,580 (down + closing). Projections, not guarantees.
Landlord ↔ Tenant lean methodology
- Overall (STATE)
- 87 Strongly Landlord-Friendly
- State Arizona
- 87 Strongly Landlord-Friendly · R+3
- County
- — inherits STATE
- City
- — inherits STATE
ZIP-level market 85741
- Rents YoY
- 1.9%
- Active inventory
- 92
- Price-to-rent
- 10.1×
Monthly cashflow live
- Estimated rent
- $1,641 medium interval (Pro) →
- Mortgage (P&I)
- −$1,041
- Tax from tax record
- −$81 /mo · $971/yr
- Insurance
- −$83
- HOA
- −$72
- Vacancy / Maint / Mgmt
- −$345
- Net cashflow
- $20
Break-even live
UW: 25.0% down · 7.5% · 30yr · 1.5% tax · 5.0% vac · 8.0% maint · 8.0% mgmt
Financing live
Cash to close
- Down payment
- $49,625
- Closing costs
- $5,955
- Reserves months
- —
- Total cash needed
- —
Loan-product check · same deal, 3 products live
Conventional
25% down · 7.5% · 30yr
- Down + closing
- —
- Monthly P&I
- —
- Monthly cashflow
- —
- DSCR
- —
- Eligible?
- —
Personal DTI + credit; lowest rate.
DSCR
20% down · 8.5% · 30yr
- Down + closing
- —
- Monthly P&I
- —
- Monthly cashflow
- —
- DSCR
- —
- Eligible?
- —
No personal income docs; deal must DSCR.
Hard money
10% down · 12.0% · 12mo
- Down + closing
- —
- Monthly P&I
- —
- Monthly cashflow
- —
- DSCR
- —
- Eligible?
- —
Short-term bridge; refi at stabilization.
HOA detail
- Monthly dues
- $72 · $864/yr
- Likely covers
- pool
Listing history 4 events
-
2026-06-18days on market $198,500 Active 3 DOM
-
2026-06-17days on market $198,500 Active 2 DOM
-
2026-06-15remarks 699-char remark
-
2026-06-15$198,500 Active 1 DOM
ⓘ Source: listings_history table (triggers on properties + properties_extension) + one-shot
backfill from property_details.listing_events for pre-trigger history.
Tax reassessment forecast AZ · Resets to sale price
- Current annual tax
- $971 · $81/mo
- Projected year-2 tax
- $1,310 · $109/mo
- Expected delta
- +$339/yr (+$28/mo · 34.9%)
ⓘ Screening estimate from a state-policy table — verify with the county assessor before closing.
Climate risk First Street
- Flood 4/10 Moderate FEMA zone X (shaded) · 22% chance over 30 yrs
- Wildfire 5/10 Major
- Heat 8/10 Severe 6 d/yr ≥107°F today · 16 d/yr by 30 yrs out
- Wind 1/10 Low
- Air quality 1/10 Low 0 unhealthy d/yr today · 0 by 30 yrs out
Nearby sold comps map
Loading sold comps map…
Walkable amenities ~0.75 mi
Loading nearby amenities…
Taxation est. · year 1
- Rental income
- $19,691
- − Mortgage interest
- −$11,119
- − Property taxes
- −$971
- − Insurance
- −$992
- − Repairs & maintenance
- −$1,575
- − Management
- −$1,575
- − HOA
- −$864
- − Depreciation
- −$5,775
- Taxable loss
- −$3,181
- Est. tax savings @ 24.0%
- +$763
- After-tax cash flow
- $1,000/yr
For passive investors: Depreciation is non-cash, so a rental often shows a tax loss while cash-flowing — sheltering income. Rental losses are passive: they offset passive income freely, and up to $25,000/yr can offset ordinary (W-2) income if you actively participate and your MAGI is under $100k (phasing out to $0 by $150k); unused losses carry forward. On sale, claimed depreciation is recaptured at up to 25%, and gains may owe capital-gains tax (a 1031 exchange can defer both). Figures are a year-1 estimate at your 24.0% rate — not tax advice; consult a CPA.
Schools (NCES district)
- District
- Flowing Wells Unified District (4405)
- NCES district ID
- 0403010
- Math proficiency
- 23% ▼ -19.00%
- Reading proficiency
- 30% ▼ -14.00%
- Median HH income
- $33,361
- Composite
- 21.69/100
- National rank
- #8271
- State rank
- #143 of 249 in AZ
Livability — Casas Adobes
- Score
- 79/100
- State rank
- #8
- US rank
- #2353
Category grades
Schools grade is shown separately in the Schools card above.
Census & demographics
- Census place
- Casas Adobes, AZ
- County
- Pima County · 1,012,107 people
- City population
- 67,940
- Metro
- Tucson, AZ
- Population (ZIP)
- 33,679
- Household income
- $76,271
- Rent vs Own
- Severe rent burden
- 1242.0
Population outlook (Pima County) Hauer SSP2
- Today (2025)
- 1,066,056 people
- By 2030
- 1,086,684 · +1.9%
- By 2040
- 1,117,160 · +4.8%
- By 2050
- 1,149,778 · +7.9%
- By 2075
- 1,271,480 · +19.3%
- By 2100
- 1,321,160 · +23.9%
Race, ethnicity, and origin ACS 2023
- Neighborhood character
- Diverse neighborhood (Simpson 0.62)
- Race & ethnicity
- White 53% Hispanic / Latino 31% Two or more races 21% Asian 5% Black 3% Native American 2%
- Hispanic origin (detail)
- Mexican 26% Puerto Rican 2%
- Common ancestry
- Italian 3% Romanian 3% Slovak 2%
- Foreign-born
- 10% · Canada, China, Jamaica
- Languages at home
- 81% English-only · Spanish 14% Chinese 1% Vietnamese 1%
Political lean MEDSL · Pima
- 2024 margin
- D (+15.2) · D 57.0% · R 41.8% · Other 1.2%
- 2008→2024 swing
- +9.1pp toward D · 2008: 6.1pp · 2024: 15.2pp
- All cycles
- 2024: D+15.2 2020: D+18.7 2016: D+13.5 2012: D+5.8 2008: D+6.1
Not yet ingested
- Civics
- —
Market trends
- HPI YoY
- ▼ -254.77%
- Current HPI
- 275.8273
- Rent YoY
- ▲ 1.88%
- Metro
- Tucson, AZ
- State GDP YoY
- ▲ 4.54%
- F500 in state
- 20
Industry mix (Fortune 500 HQ in AZ)
| Industry | F500 HQs | Revenue |
|---|---|---|
| Technology | 2 | $13B |
|
||
| Mining / Metals | 1 | $23B |
|
||
| Environmental Services | 1 | $16B |
|
||
| Metals / Steel | 1 | $14B |
|
||
| Technology Distribution | 1 | $9B |
|
||
| Homebuilding | 1 | $8B |
|
||
Price history
+148.1% since first listed29 events — show timeline
- 2026-06-15 Listed $198,500 MLSSAZ
- 2026-01-23 Sold (Public Records) $130,340 Public Records
- 2026-01-23 Sold (MLS) $134,340 MLSSAZ
- 2026-01-12 Pending — MLSSAZ
- 2025-12-26 Contingent — MLSSAZ
- 2025-11-06 Price Changed $145,000 MLSSAZ
- 2025-10-26 Listed $175,000 MLSSAZ
- 2025-04-02 Pending — MLSSAZ
- 2025-04-01 Sold (MLS) $105,000 MLSSAZ
- 2025-02-24 Contingent — MLSSAZ
- 2025-02-20 Price Changed $115,000 MLSSAZ
- 2024-11-23 Price Changed $122,000 MLSSAZ
- 2024-10-14 Listed $125,000 MLSSAZ
- 2018-11-30 Sold (Public Records) $61,500 Public Records
- 2018-11-30 Sold (MLS) $61,500 MLSSAZ
- 2018-11-28 Pending — MLSSAZ
- 2018-11-09 Listed $69,900 MLSSAZ
- 2018-11-08 Listing Removed — MLSSAZ
- 2018-10-26 Price Changed $69,900 MLSSAZ
- 2018-09-10 Price Changed $43,900 MLSSAZ
- 2018-07-16 Listed $38,900 MLSSAZ
- 2018-06-29 Sold (MLS) $20,500 MLSSAZ
- 2018-06-21 Pending — MLSSAZ
- 2018-06-13 Price Changed $29,900 MLSSAZ
- 2018-05-20 Listed $40,000 MLSSAZ
- 1980-03-26 Sold (Public Records) $28,000 Public Records
- 1979-03-01 Sold (Public Records) $16,000 Public Records
- 1978-12-01 Sold (Public Records) $61,200 Public Records
- 1977-12-01 Sold (Public Records) $80,000 Public Records
Property tax history
+2.7%/yrLatest (2025): $971 · +4.6% YoY. Source: county tax records.
Cash-flow waterfall
monthlySold comps — $/sqft
last 12 mo · ≤1 miLoading sold comps…