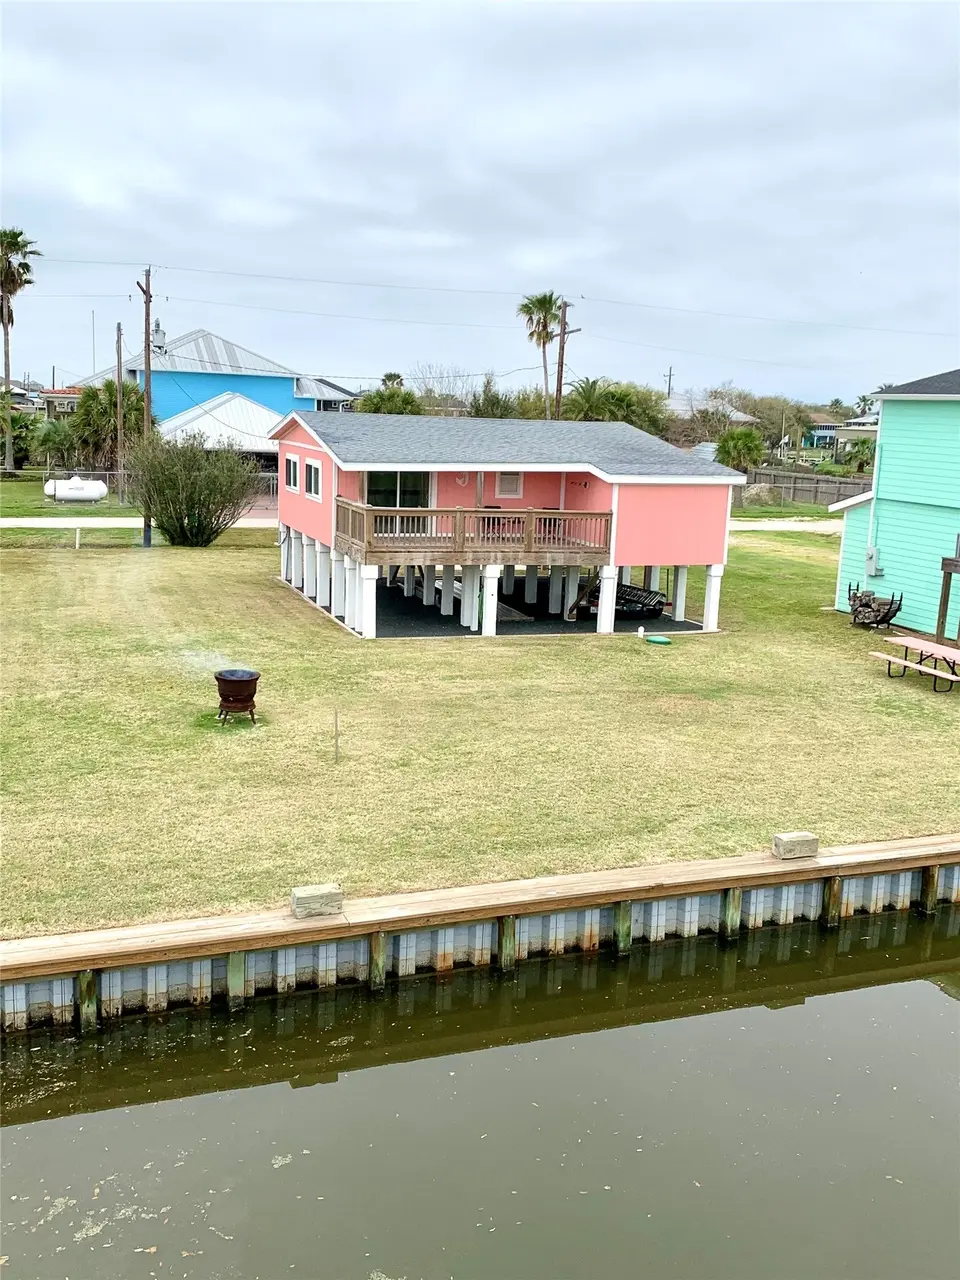
1102 Mayes
Bolivar Peninsula, TX 77650
$240,000C-
1 bd · 1.0 ba ·
821 sqft ·
Built 1967
· SingleFamily
· Active
· 514 DOM
Cashflow @ list (25.0% down · 7.5%)
Estimated rent
$2,050/mo
Mortgage (P&I)
−$1,259
Tax + insurance
−$677
HOA
−$0
Vac / Maint / Mgmt
−$430
Net cashflow
$-316/mo
Annual
$-3,793/yr
Cap rate
6.85%
Cash-on-cash
1.97%
DSCR
1.09
1% rule
0.85%
Cash to close
$67,200
Investor read
- This is a 1-bed/1.0-bath single-family listed at $240k.
- At list price, monthly cash flow is $-316 ($-4k/yr) — negative.
- To cash-flow at today's rent, offer at most $184k (23.3% below list).
- To meet the 1% rule (rent ≥ 1% of price), the offer needs to be $205k (14.6% below list).
- It's been on market 514 days — a 12% lower offer ($211k) is reasonable based on typical stale-listing flexibility.
- Recommended offer: $184k (23.3% below list) — sets the bar for cash-flow.
- Local home prices are declining (-3.0%/yr); year-one equity from $2k of loan paydown is wiped out by about $7k of value loss. Plan a longer hold.
- Location reads 65/100 on livability (#719 in TX) — a middle-class / working-renter tenant base. Strengths: crime A+, cost of living A+, housing A+; Watch: schools D+, amenities F, commute F.
- Galveston ISD (town): math 33% / reading 39% proficiency, ranked #514 of 826 in TX (top 62%) — families likely to look elsewhere, expect single-tenant / working-renter base with shorter leases; 68% free/reduced lunch — lower-income household profile, screen leases tightly.
- Watch-outs: flood insurance adds $427/mo.
- Market conditions: 770 active listings in the ZIP; 1 comparable units currently listed for rent nearby; 3,258 units permitted in Galveston County in 2024 (0 in 5+ unit buildings).
- Galveston County population projected at +43% by 2050 — long-run rental-demand tailwind backs the buy-and-hold thesis.
- Climate carrying-cost: in FEMA flood zone AE (mandatory federal flood insurance); severe wind risk, 99% chance of damaging wind over 30y; extreme-heat days projected 7→26/yr by 2055 (HVAC capex compounding) — expect insurance premiums to compound above CPI over the hold.
- Cap rate 6.8% vs local median 2.1% in Bolivar Peninsula — top-decile yield for the area; either an underpriced asset or a hidden risk that comps aren't pricing in. Stress-test before assuming the spread holds.
Questions for listing agent
- What do current leases actually rent for vs. the listed asking? Can we see a recent rent roll and the last 12 months of T-12 income?
- It's been on market 514 days. Have you received any prior offers? Is the seller open to a 23% concession, seller financing, or rate buy-down credit?
- Built in 1967 — when were the roof, HVAC, electrical panel, plumbing, and water heater last replaced?
- What's the actual annual flood-insurance premium (NFIP or private), and is the property in a SFHA with mandatory coverage?
- Why hasn't it sold? Are there any deal-killer items the seller is aware of (foundation, flood, title, zoning, code violations)?
- Is there a deadline driving the sale (1031 exchange, divorce, estate, relocation)? That informs how much negotiation room exists.
- Schools are D-rated, which usually means shorter tenancies and higher turnover. Who's the typical renter profile here, and what's been the actual vacancy rate?
- What's the average days-on-market for RENTAL listings here right now (not sales)? A rising rental-DOM trend means longer vacancies and softer asking-rent achievability than the comps imply.
CashFlowRE · CFR-8VC56R6GKF3B0J
· Data 2 days ago
cashflowre.app · 2026-05-29