1102 Mayes · Bolivar Peninsula, TX
Flood risk 10/10 · Severe
- FEMA flood zone
- AE
- Chance of flooding over 30 yrs
- 0.99%
- Est. flood insurance / yr
- $1,737 – $8,500
Fire risk 4/10 · Minor
- Est. fire insurance / yr
- $1,222 – $2,270
Heat risk 10/10 · Severe
- Hot days now (above 107°F)
- 7 days/yr
- Hot days in 30 yrs
- 26 days/yr
Wind risk 10/10 · Severe
- Chance of severe wind over 30 yrs
- 99.0%
Air-quality risk 2/10 · Minimal
- Unhealthy air days now
- 2 days/yr
- Unhealthy air days in 30 yrs
- 2 days/yr
Risk factors via First Street. Map © Google.
Why this score? — see what drove the C- grade
The composite is a weighted blend of 9 inputs, each scored 0–100. Each bar is that input's sub-score; the figure is the points it added to the 100-point composite (weight × sub-score).
- Cash flow +15.8/30.0
- ARV discount +15.0/15.0
- DSCR +4.9/10.0
- 1% rule +3.5/10.0
- Livability +3.2/5.0
- Schools +3.0/10.0
- Appreciation +2.7/10.0
- Rent growth +2.5/5.0
- Condition / age +2.5/5.0
$240,000
🖨 Deal sheet 📄 Offer letter ✓ Due diligence
Listing remarks MLS
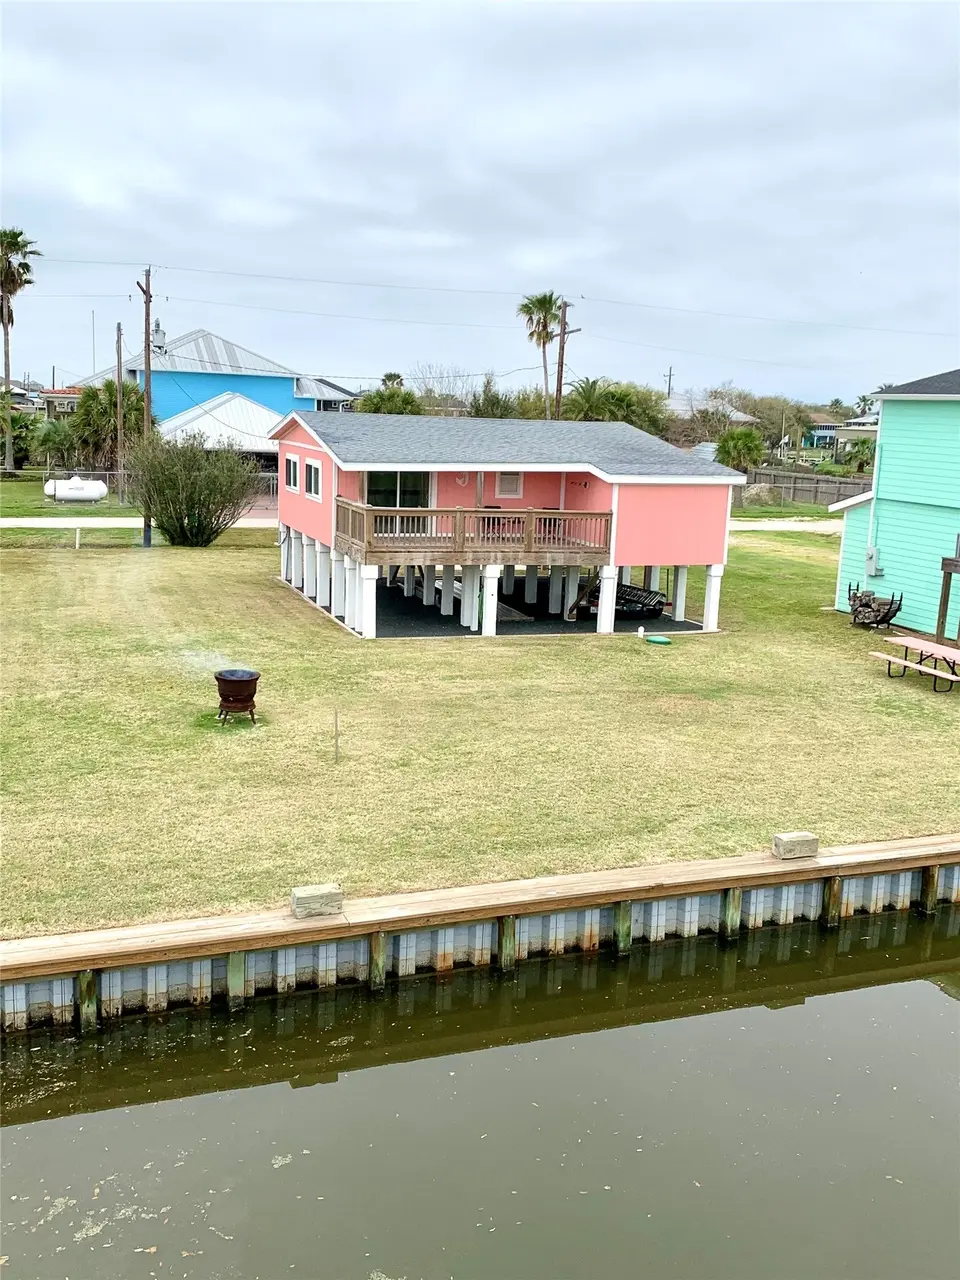
Super cute canal house located in Blue Water Addition. Open kitchen and living area and one large bedroom. Recently painted. The deck is partially covered. Nice bulkhead. This canal goes out to the Intracoastal waterway. Affordable waterfront get-a-way. with a peaceful, quiet place to fish and relax. Sells furnished with a few exceptions.
Key facts
- Nice bulkhead
- Canal house
- Open kitchen
Tags
Neighborhood map
What this means for you Summary
Snapshot
- This is a 1-bed/1.0-bath single-family listed at $240k.
Deal economics
- At list price, monthly cash flow is $-316 ($-4k/yr) — negative.
- To cash-flow at today's rent, offer at most $184k (23.3% below list).
- To meet the 1% rule (rent ≥ 1% of price), the offer needs to be $205k (14.6% below list).
- Recommended offer: $184k (23.3% below list) — sets the bar for cash-flow.
- Cap rate 6.8% vs local median 2.1% in Bolivar Peninsula — top-decile yield for the area; either an underpriced asset or a hidden risk that comps aren't pricing in. Stress-test before assuming the spread holds.
Location & tenants
- Location reads 65/100 on livability (#719 in TX) — a middle-class / working-renter tenant base. Strengths: crime A+, cost of living A+, housing A+; Watch: schools D+, amenities F, commute F.
- Galveston ISD (town): math 33% / reading 39% proficiency, ranked #514 of 826 in TX (top 62%) — families likely to look elsewhere, expect single-tenant / working-renter base with shorter leases; 68% free/reduced lunch — lower-income household profile, screen leases tightly.
- Market conditions: 770 active listings in the ZIP; 1 comparable units currently listed for rent nearby; 3,258 units permitted in Galveston County in 2024 (0 in 5+ unit buildings).
Forward outlook
- Local home prices are declining (-3.0%/yr); year-one equity from $2k of loan paydown is wiped out by about $7k of value loss. Plan a longer hold.
- Galveston County population projected at +43% by 2050 — long-run rental-demand tailwind backs the buy-and-hold thesis.
Negotiation context
- It's been on market 514 days — a 12% lower offer ($211k) is reasonable based on typical stale-listing flexibility.
Risks & watch-outs
- Watch-outs: flood insurance adds $427/mo.
- Climate carrying-cost: in FEMA flood zone AE (mandatory federal flood insurance); severe wind risk, 99% chance of damaging wind over 30y; extreme-heat days projected 7→26/yr by 2055 (HVAC capex compounding) — expect insurance premiums to compound above CPI over the hold.
Questions for the listing agent
- What do current leases actually rent for vs. the listed asking? Can we see a recent rent roll and the last 12 months of T-12 income?
- It's been on market 514 days. Have you received any prior offers? Is the seller open to a 23% concession, seller financing, or rate buy-down credit?
- Built in 1967 — when were the roof, HVAC, electrical panel, plumbing, and water heater last replaced?
- What's the actual annual flood-insurance premium (NFIP or private), and is the property in a SFHA with mandatory coverage?
- Why hasn't it sold? Are there any deal-killer items the seller is aware of (foundation, flood, title, zoning, code violations)?
- Is there a deadline driving the sale (1031 exchange, divorce, estate, relocation)? That informs how much negotiation room exists.
- Schools are D-rated, which usually means shorter tenancies and higher turnover. Who's the typical renter profile here, and what's been the actual vacancy rate?
- What's the average days-on-market for RENTAL listings here right now (not sales)? A rising rental-DOM trend means longer vacancies and softer asking-rent achievability than the comps imply.
- What's the recent tenant-quality profile in this submarket — average credit score on applications, eviction rate, late-payment / NSF rate, and stable-employment percentage? A property-management company in the area should have these aggregated.
- How much new for-sale + rental construction is in the pipeline within 1–3 miles? Heavy new supply typically softens prices + rents 12–24 months out; constrained supply supports both.
Investment metrics
- 1% rule
- 0.85% ✗
- Cap rate
- 6.85%
- Cash-on-cash
- 1.97%
- DSCR
- 1.09
- GRM
- 9.8
CMA / ARV
- ARV (median comp)
- $287,946
- List price
- $240,000
- Delta
- -16.65%
- Verdict
- UNDERPRICED
- Comps
- 20 within 1.0 mi
Show comp detail 3 sales within ~0.75 mi
| Address | Dist | Beds/Ba | Sqft | Sold | Price | $/sf | Match |
|---|---|---|---|---|---|---|---|
| 987 S Jacks Rd | 0.37mi | 2/1.0 (+1) | 800 (-3%) | 23mo | $299,900 | $375 | 55 |
| 1134 Mayes Rd | 0.15mi | 2/1.0 (+1) | 924 (+12%) | 19mo | $400,000 | $433 | 51 |
| 847 S Selwyn Rd | 0.63mi | 2/2.0 (+1) | 810 (-1%) | 12mo | $275,000 | $340 | 50 |
Match score weights: distance 35% · size 25% · config 20% · recency 20%. Top-matched comps best support the ARV.
Projected returns pro-forma
-3.0% appreciation · 3.0% rent growth · sell at horizon
- IRR
- -25.8%
- Equity multiple
- 0.12×
- Total profit
- $-58,818
- Equity at exit
- $35,785
- IRR
- -22.1%
- Equity multiple
- -0.14×
- Total profit
- $-76,320
- Equity at exit
- $20,751
Cash invested: $67,200 (down + closing). Projections, not guarantees.
Landlord ↔ Tenant lean methodology
- Overall (STATE)
- 87 Strongly Landlord-Friendly
- State Texas
- 87 Strongly Landlord-Friendly · R+5
- County
- — inherits STATE
- City
- — inherits STATE
ZIP-level market 77650
- Home prices YoY
- -1.9%
- Active inventory
- 770
- Price-to-rent
- 9.8×
Monthly cashflow live
- Estimated rent
- $2,050 medium interval (Pro) →
- Mortgage (P&I)
- −$1,259
- Tax from tax record
- −$150 /mo · $1,805/yr
- Insurance
- −$100
- Flood insurance flood zone
- −$427 /mo · $5,118/yr
- HOA
- −$0
- Vacancy / Maint / Mgmt
- −$430
- Net cashflow
- $-316
Break-even live
UW: 25.0% down · 7.5% · 30yr · 1.5% tax · 5.0% vac · 8.0% maint · 8.0% mgmt
Financing live
Cash to close
- Down payment
- $60,000
- Closing costs
- $7,200
- Reserves months
- —
- Total cash needed
- —
Loan-product check · same deal, 3 products live
Conventional
25% down · 7.5% · 30yr
- Down + closing
- —
- Monthly P&I
- —
- Monthly cashflow
- —
- DSCR
- —
- Eligible?
- —
Personal DTI + credit; lowest rate.
DSCR
20% down · 8.5% · 30yr
- Down + closing
- —
- Monthly P&I
- —
- Monthly cashflow
- —
- DSCR
- —
- Eligible?
- —
No personal income docs; deal must DSCR.
Hard money
10% down · 12.0% · 12mo
- Down + closing
- —
- Monthly P&I
- —
- Monthly cashflow
- —
- DSCR
- —
- Eligible?
- —
Short-term bridge; refi at stabilization.
Rent comps 1 comps
| Address | Beds | Baths | Sqft | Rent | $/sqft | DOM | Units | Dist |
|---|---|---|---|---|---|---|---|---|
| 1166 N Jacks Rd Port Bolivar, TX | 2.0 | 1.0 | 918 | $2,050 | $2.23 | 2d | 1 | 0.15mi |
Listing history 15 events
-
2026-06-18days on market $240,000 Active 514 DOM
-
2026-06-17days on market $240,000 Active 513 DOM
-
2026-06-16days on market $240,000 Active 512 DOM
-
2026-06-15days on market $240,000 Active 511 DOM
-
2026-06-13days on market $240,000 Active 509 DOM
-
2026-06-09days on market $240,000 Active 505 DOM
-
2026-06-08days on market $240,000 Active 504 DOM
-
2026-06-07days on market $240,000 Active 503 DOM
-
2026-06-04days on market $240,000 Active 500 DOM
-
2026-06-03days on market $240,000 Active 499 DOM
-
2026-06-01days on market $240,000 Active 497 DOM
-
2026-05-31days on market $240,000 Active 496 DOM
-
2025-12-09price $240,000 347-char remark
Show marketing remark (347 chars)
Super cute canal house located in Blue Water Addition. Open kitchen and living area and one large bedroom. Recently painted. The deck is partially covered. Nice bulkhead. This canal goes out to the Intracoastal waterway. Affordable waterfront get-a-way. with a peaceful, quiet place to fish and relax. Sells furnished with a few exceptions.
-
2025-07-11price $260,000 347-char remark
Show marketing remark (347 chars)
Super cute canal house located in Blue Water Addition. Open kitchen and living area and one large bedroom. Recently painted. The deck is partially covered. Nice bulkhead. This canal goes out to the Intracoastal waterway. Affordable waterfront get-a-way. with a peaceful, quiet place to fish and relax. Sells furnished with a few exceptions.
-
2025-01-20$280,000 Active 347-char remark
Show marketing remark (347 chars)
Super cute canal house located in Blue Water Addition. Open kitchen and living area and one large bedroom. Recently painted. The deck is partially covered. Nice bulkhead. This canal goes out to the Intracoastal waterway. Affordable waterfront get-a-way. with a peaceful, quiet place to fish and relax. Sells furnished with a few exceptions.
ⓘ Source: listings_history table (triggers on properties + properties_extension) + one-shot
backfill from property_details.listing_events for pre-trigger history.
Tax reassessment forecast TX · Resets to sale price
- Current annual tax
- $1,805 · $150/mo
- Projected year-2 tax
- $4,392 · $366/mo
- Expected delta
- +$2,587/yr (+$216/mo · 143.3%)
ⓘ Screening estimate from a state-policy table — verify with the county assessor before closing.
Climate risk First Street
- Flood 10/10 Extreme FEMA zone AE · 99% chance over 30 yrs
- Wildfire 4/10 Moderate
- Heat 10/10 Extreme 7 d/yr ≥107°F today · 26 d/yr by 30 yrs out
- Wind 10/10 Extreme 99% chance of damaging wind over 30 yrs
- Air quality 2/10 Low 2 unhealthy d/yr today · 2 by 30 yrs out
Nearby sold comps map
Loading sold comps map…
Walkable amenities ~0.75 mi
Loading nearby amenities…
Taxation est. · year 1
- Rental income
- $24,600
- − Mortgage interest
- −$13,444
- − Property taxes
- −$1,805
- − Insurance
- −$6,319
- − Repairs & maintenance
- −$1,968
- − Management
- −$1,968
- − Depreciation
- −$6,982
- Taxable loss
- −$7,885
- Est. tax savings @ 24.0%
- +$1,892
- After-tax cash flow
- $-1,900/yr
For passive investors: Depreciation is non-cash, so a rental often shows a tax loss while cash-flowing — sheltering income. Rental losses are passive: they offset passive income freely, and up to $25,000/yr can offset ordinary (W-2) income if you actively participate and your MAGI is under $100k (phasing out to $0 by $150k); unused losses carry forward. On sale, claimed depreciation is recaptured at up to 25%, and gains may owe capital-gains tax (a 1031 exchange can defer both). Figures are a year-1 estimate at your 24.0% rate — not tax advice; consult a CPA.
Schools (NCES district)
- District
- Galveston ISD
- NCES district ID
- 4820280
- Math proficiency
- 33% ▼ -14.00%
- Reading proficiency
- 39% ▼ -4.00%
- Median HH income
- $40,162
- Composite
- 30.22/100
- National rank
- #6299
- State rank
- #514 of 826 in TX
Livability — Bolivar Peninsula
- Score
- 65/100
- State rank
- #719
- US rank
- #13437
Category grades
Schools grade is shown separately in the Schools card above.
Census & demographics
- Census place
- Bolivar Peninsula, TX
- City population
- 2,957
- Population (ZIP)
- 2,362
Population outlook (Galveston County) Hauer SSP2
- Today (2025)
- 390,640 people
- By 2030
- 425,226 · +8.9%
- By 2040
- 493,765 · +26.4%
- By 2050
- 559,698 · +43.3%
- By 2075
- 719,260 · +84.1%
- By 2100
- 819,628 · +109.8%
Race, ethnicity, and origin ACS 2023
- Neighborhood character
- Predominantly White (70%)
- Race & ethnicity
- White 70% Hispanic / Latino 21% Two or more races 10% Black 8%
- Hispanic origin (detail)
- Mexican 14%
- Common ancestry
- Lithuanian 6% Romanian 3% Iranian 3%
- Foreign-born
- 13% · Canada
- Languages at home
- 85% English-only · Spanish 14% German/W. Germanic 1%
Political lean MEDSL · Galveston
- 2024 margin
- Strong R (+27.4) · D 35.7% · R 63.1% · Other 1.2%
- 2008→2024 swing
- -7.9pp toward R · 2008: -19.5pp · 2024: -27.4pp
- All cycles
- 2024: R+27.4 2020: R+22.6 2016: R+22.6 2012: R+26.9 2008: R+19.5
Not yet ingested
- Civics
- —
Market trends
- HPI YoY
- ▼ -4.52%
- Current HPI
- 231.5074
- Rent YoY
- —
- Metro
- —
- State GDP YoY
- ▲ 3.95%
- F500 in state
- 110
Industry mix (Fortune 500 HQ in TX)
| Industry | F500 HQs | Revenue |
|---|---|---|
| Energy | 16 | $1,198B |
|
||
| Technology | 5 | $198B |
|
||
| Engineering / Construction | 4 | $72B |
|
||
| Energy Services | 3 | $60B |
|
||
| Utilities | 3 | $41B |
|
||
| Healthcare | 2 | $330B |
|
||
Price history
-14.3% since first listed3 events — show timeline
- 2025-12-09 Price Changed $240,000 HARMLS
- 2025-07-11 Price Changed $260,000 HARMLS
- 2025-01-20 Listed $280,000 HARMLS
Property tax history
+4.1%/yrLatest (2025): $1,805 · -38.7% YoY. Source: county tax records.
Cash-flow waterfall
monthlySold comps — $/sqft
last 12 mo · ≤1 miLoading sold comps…