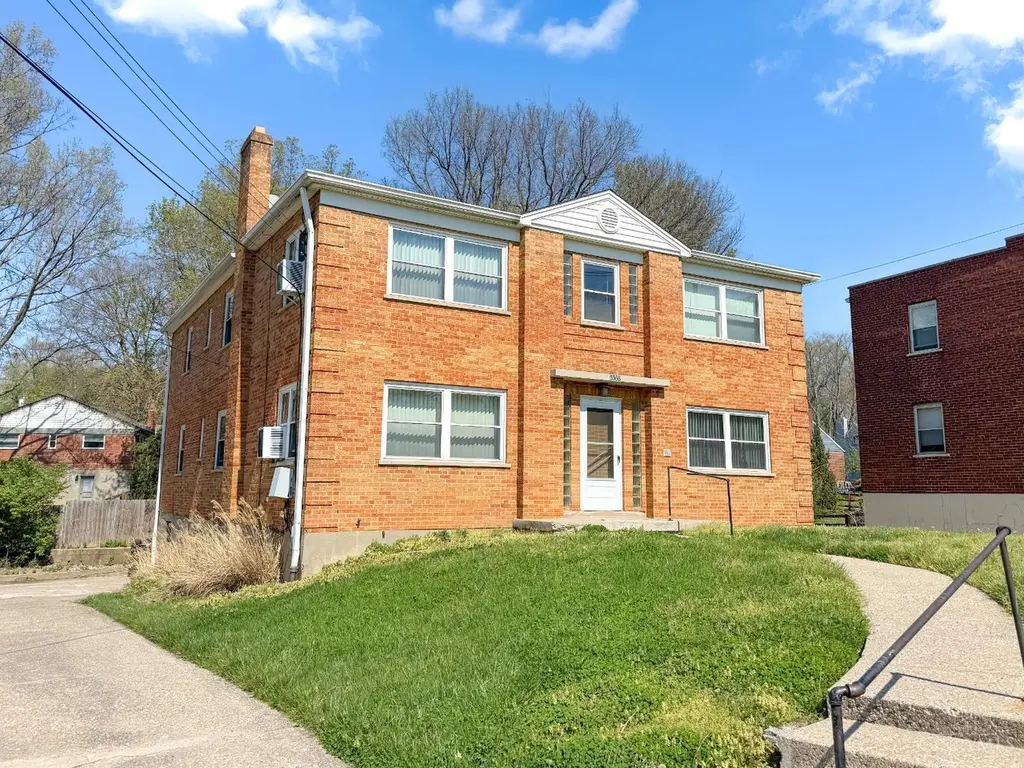
5568 Beechmont Ave
Cincinnati, OH 45230
$450,000C
24 bd · 16.0 ba ·
— sqft ·
Built 1952
· MultiFamily
· Contingency Pending
· 10 DOM
Cashflow @ list (25.0% down · 7.5%)
Estimated rent
$4,877/mo
Mortgage (P&I)
−$2,360
Tax + insurance
−$720
HOA
−$0
Vac / Maint / Mgmt
−$1,024
Net cashflow
$773/mo
Annual
$9,281/yr
Cap rate
8.36%
Cash-on-cash
7.37%
DSCR
1.33
1% rule
1.08%
Cash to close
$126,000
Investor read
- This is a 2×1bd/1ba + 2×2bd/1ba units multifamily listed at $450k.
- At list price, monthly cash flow is $773 ($9k/yr) — positive. Per door: $193/mo.
- The deal already cash-flows at list — no discount required.
- Meets the 1% rule at list price ($5k rent vs $450k).
- Only 10 days on market — expect competitive offers; lowballing is unlikely to land.
- Local home prices are declining (-3.0%/yr); year-one equity from $3k of loan paydown is wiped out by about $14k of value loss. Plan a longer hold.
- Location reads 80/100 on livability (#130 in OH, #1,856 nationally) — a professional / high-income tenant draw. Strengths: amenities A+, commute A+, cost of living A+; Watch: employment D, crime F.
- Cincinnati Public Schools (urban): math 25% / reading 36% proficiency, ranked #581 of 656 in OH (top 89%) — families likely to look elsewhere, expect single-tenant / working-renter base with shorter leases; 70% free/reduced lunch — lower-income household profile, screen leases tightly.
- Zoned schools: Sands Montessori School (math 70% / reading 77%, grade A, #311 of 1,584 statewide, top 20%, 683 students, 22% FRL); Hartwell School (math 17% / reading 31%, grade F, #593 of 654 statewide, top 91%, 447 students, 0% FRL); Walnut Hills High School (math 79% / reading 89%, grade A, #17 of 781 statewide, top 2%, 2,582 students, 14% FRL) — zoned schools average 12% FRL vs 70% district-wide (59 pts lower); this property's tenant base skews higher-income than the district average.
- Zoned-school proficiency averages 60% at this address vs 30% district-wide (+30 pts) — the actual schools serving this property are materially stronger than the Cincinnati Public Schools average implies; a family-tenant draw the district grade alone would hide.
- Watch-outs: built in 1952 — expect roof / HVAC / electrical / plumbing capex.
- Market conditions: Rents rising (+2.4%/yr); 60 active listings in the ZIP; solid renter incomes; 801 units permitted in Hamilton County in 2024 (190 in 5+ unit buildings).
- 3 sale attempts since 24y ago with the ask held roughly flat each time — persistent listings suggest the price (not the market) is what's stuck; bring a comps-based counter.
- Current owner paid $202k; list at $450k implies a 123% gain — meaningful room to come down on a strong offer.
- Climate carrying-cost: moderate flood risk; extreme-heat days projected 7→19/yr by 2055 (HVAC capex compounding) — expect insurance premiums to compound above CPI over the hold.
- Cap rate 8.4% vs local median 3.9% in Cincinnati — top-decile yield for the area; either an underpriced asset or a hidden risk that comps aren't pricing in. Stress-test before assuming the spread holds.
- At $4,877/mo this rent would consume 65% of the median local household income ($90k/yr) (locally 527% of renters already pay >50% of income on rent) — very limited rent-growth headroom before tenants either downsize or default.
Questions for listing agent
- Can we see the unit-by-unit rent roll, current vacancy, and any below-market leases? What's the average tenancy length?
- What capital expenditures (roof, boiler, parking lot, exteriors) have been made in the last 5 years, and what's planned in the next 2?
- Built in 1952 — when were the roof, HVAC, electrical panel, plumbing, and water heater last replaced?
- Is there a deadline driving the sale (1031 exchange, divorce, estate, relocation)? That informs how much negotiation room exists.
- Schools are B-rated — typically a magnet for longer-tenancy family renters. What's the average tenant stay here, and is there a school-zone premium baked into asking?
- Crime grade is F in this area — have there been break-ins, vandalism, or insurance claims at this property in the last 3 years? What carrier currently insures it and at what premium?
- What's the average days-on-market for RENTAL listings here right now (not sales)? A rising rental-DOM trend means longer vacancies and softer asking-rent achievability than the comps imply.
- What's the recent tenant-quality profile in this submarket — average credit score on applications, eviction rate, late-payment / NSF rate, and stable-employment percentage? A property-management company in the area should have these aggregated.
CashFlowRE · CFR-8VZ37544BWNY1A
· Data 17 h ago
cashflowre.app · 2026-05-29