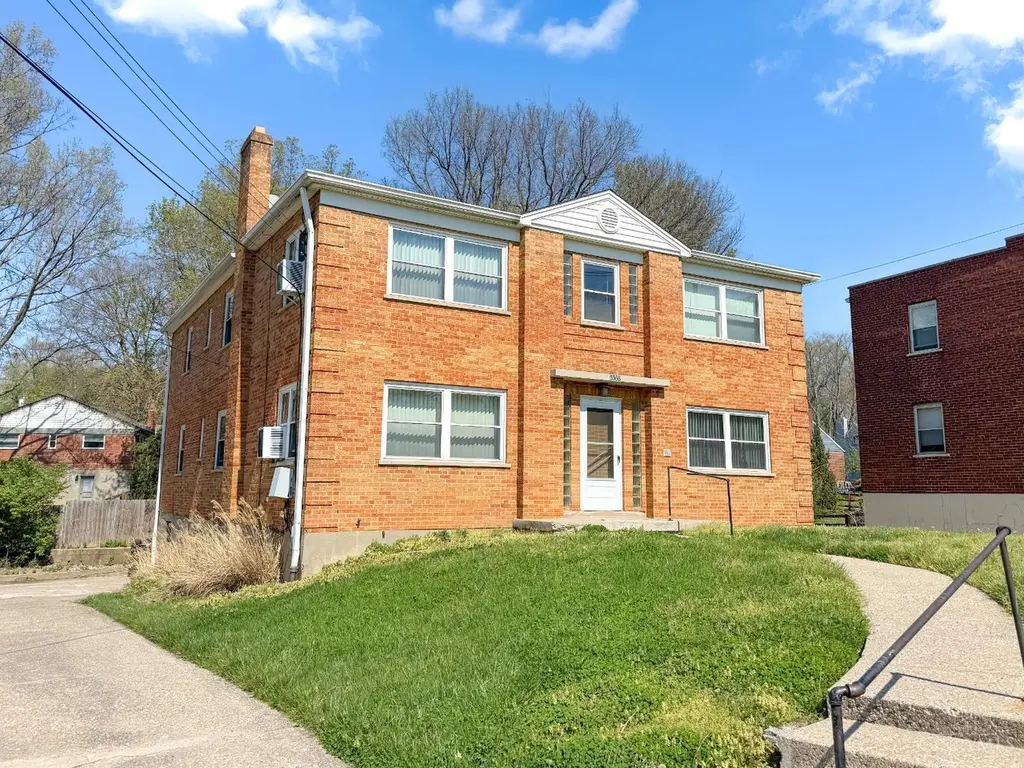
 Fourplex
5568 Beechmont Ave · Cincinnati, OH
Flood risk 5/10 · Moderate
- FEMA flood zone
- X (unshaded)
- Chance of flooding over 30 yrs
- 0.24%
- Est. flood insurance / yr
- $507 – $1,088
Fire risk 1/10 · Minimal
- Est. fire insurance / yr
- $713 – $1,323
Heat risk 5/10 · Moderate
- Hot days now (above 102°F)
- 7 days/yr
- Hot days in 30 yrs
- 19 days/yr
Wind risk 2/10 · Minimal
- Chance of severe wind over 30 yrs
- 1.0%
Air-quality risk 3/10 · Minor
- Unhealthy air days now
- 2 days/yr
- Unhealthy air days in 30 yrs
- 4 days/yr
Risk factors via First Street. Map © Google.
Why this score? — see what drove the C grade
The composite is a weighted blend of 9 inputs, each scored 0–100. Each bar is that input's sub-score; the figure is the points it added to the 100-point composite (weight × sub-score).
- Cash flow +22.7/30.0
- ARV discount +7.5/15.0
- DSCR +7.3/10.0
- 1% rule +5.8/10.0
- Livability +4.0/5.0
- Rent growth +3.1/5.0
- Schools +2.5/10.0
- Condition / age +2.5/5.0
- Appreciation +0.0/10.0
$450,000
🖨 Deal sheet (PDF) 📄 Offer letter ✓ Due diligence
Multi-family units
County records classify this as Multi-Family (5+ Unit). Listing-text estimate: 4 units. estimate disagrees with records
5+ unit building — per-unit beds/baths from public records are typically unavailable; the breakdown below (if shown) is an estimate from the listing text.
Listing remarks MLS
Lovely bldg. through-out and well maintained.Super nice wood floors,and beautiful tile baths.Newer hot water heat. Tenants pay own elect. and a/c.Is located on the bus line.4 car rear entry garage.
Key facts
- 9,845 sq ft lot
- 4 garage spots
- Built 1952
Property features AI
Finance
- Other: Owner pays heat and water
- Financial info: Two 1-bedroom units listed with rent around $900 each; Two 2-bedroom units listed with rent around $1,125 each; Semi-annual taxes reported (financial specifics provided but not included per instructions)
- HOA & community: No HOA information provided
Exterior
- Parking: Built-in rear garage with 4 garage spaces; 4 additional open parking spaces
- Security: No security features provided
- Utilities: Public water; Public sewer; Natural gas
- Home design: Quad (four-unit) property; Two levels
- Construction: Brick construction; Shingle roof; Poured foundation; Built as a single building (one building total)
- Exterior features: Casement windows; Lot size about 0.226 acres
Interior
- Kitchen: No appliance details provided
- Bedrooms: Four units total: two 1-bedroom units and two 2-bedroom units; Unit breakdown: Unit 1 — 1 bedroom; Unit 2 — 2 bedrooms; Unit 3 — 1 bedroom; Unit 4 — 2 bedrooms
- Flooring: No flooring details provided
- Bathrooms: Each unit has one full bathroom (four full bathrooms total)
- Heating & cooling: Gas heating with hot water system; Wall air conditioning units; Owner pays heat and water; Separate gas/electric utilities for units; No separate furnace
- Interior features: Full basement
- Laundry & utility: No laundry appliance details provided
Neighborhood map
What this means for you Summary
Snapshot
- This is a 2×1bd/1ba + 2×2bd/1ba units multifamily listed at $450k.
Deal economics
- At list price, monthly cash flow is $773 ($9k/yr) — positive. Per door: $193/mo.
- The deal already cash-flows at list — no discount required.
- Meets the 1% rule at list price ($5k rent vs $450k).
- Cap rate 8.4% vs local median 3.9% in Cincinnati — top-decile yield for the area; either an underpriced asset or a hidden risk that comps aren't pricing in. Stress-test before assuming the spread holds.
Location & tenants
- Location reads 80/100 on livability (#130 in OH, #1,856 nationally) — a professional / high-income tenant draw. Strengths: amenities A+, commute A+, cost of living A+; Watch: employment D, crime F.
- Cincinnati Public Schools (urban): math 25% / reading 36% proficiency, ranked #581 of 656 in OH (top 89%) — families likely to look elsewhere, expect single-tenant / working-renter base with shorter leases; 70% free/reduced lunch — lower-income household profile, screen leases tightly.
- Market conditions: Rents rising (+2.4%/yr); 60 active listings in the ZIP; solid renter incomes; 801 units permitted in Hamilton County in 2024 (190 in 5+ unit buildings).
- At $4,877/mo this rent would consume 65% of the median local household income ($90k/yr) (locally 527% of renters already pay >50% of income on rent) — very limited rent-growth headroom before tenants either downsize or default.
Forward outlook
- Local home prices are declining (-3.0%/yr); year-one equity from $3k of loan paydown is wiped out by about $14k of value loss. Plan a longer hold.
Negotiation context
- Only 10 days on market — expect competitive offers; lowballing is unlikely to land.
- 3 sale attempts since 24y ago with the ask held roughly flat each time — persistent listings suggest the price (not the market) is what's stuck; bring a comps-based counter.
- Current owner paid $202k; list at $450k implies a 123% gain — meaningful room to come down on a strong offer.
Risks & watch-outs
- Watch-outs: built in 1952 — expect roof / HVAC / electrical / plumbing capex.
- Climate carrying-cost: moderate flood risk; extreme-heat days projected 7→19/yr by 2055 (HVAC capex compounding) — expect insurance premiums to compound above CPI over the hold.
Questions for the listing agent
- Can we see the unit-by-unit rent roll, current vacancy, and any below-market leases? What's the average tenancy length?
- What capital expenditures (roof, boiler, parking lot, exteriors) have been made in the last 5 years, and what's planned in the next 2?
- Built in 1952 — when were the roof, HVAC, electrical panel, plumbing, and water heater last replaced?
- Is there a deadline driving the sale (1031 exchange, divorce, estate, relocation)? That informs how much negotiation room exists.
- Schools are B-rated — typically a magnet for longer-tenancy family renters. What's the average tenant stay here, and is there a school-zone premium baked into asking?
- Crime grade is F in this area — have there been break-ins, vandalism, or insurance claims at this property in the last 3 years? What carrier currently insures it and at what premium?
- What's the average days-on-market for RENTAL listings here right now (not sales)? A rising rental-DOM trend means longer vacancies and softer asking-rent achievability than the comps imply.
- What's the recent tenant-quality profile in this submarket — average credit score on applications, eviction rate, late-payment / NSF rate, and stable-employment percentage? A property-management company in the area should have these aggregated.
- How much new apartment / multifamily construction is in the pipeline within 1–3 miles? Heavy new supply (>2% of stock underway) typically softens rents 12–24 months out; light construction supports rent growth.
Investment metrics
- 1% rule
- 1.08% ✓
- Cap rate
- 8.36%
- Cash-on-cash
- 7.37%
- DSCR
- 1.33
- GRM
- 7.7
CMA / ARV
No comps found within radius.
Projected returns pro-forma
-3.0% appreciation · 2.39% rent growth · sell at horizon
- IRR
- -5.7%
- Equity multiple
- 0.79×
- Total profit
- $-26,580
- Equity at exit
- $67,096
- IRR
- 3.2%
- Equity multiple
- 1.23×
- Total profit
- $28,447
- Equity at exit
- $38,908
Cash invested: $126,000 (down + closing). Projections, not guarantees.
Landlord ↔ Tenant lean methodology
- Overall (STATE)
- 73 Landlord-Friendly
- State Ohio
- 73 Landlord-Friendly · R+6
- County
- — inherits STATE
- City
- — inherits STATE
ZIP-level market 45230
- Rents YoY
- 2.4%
- Active inventory
- 60
- Price-to-rent
- 34.0×
Monthly cashflow live
- Estimated rent
- $4,877 high interval (Pro) →
- Mortgage (P&I)
- −$2,360
- Tax from tax record
- −$532 /mo · $6,385/yr
- Insurance
- −$188
- HOA
- −$0
- Vacancy / Maint / Mgmt
- −$1,024
- Net cashflow
- $773
Break-even live
Sensitivity live
| Price | -10% $1,028 | -5% $901 | +0% $773 | +5% $646 | +10% $519 |
|---|---|---|---|---|---|
| Rent | -10% $388 | -5% $581 | +0% $773 | +5% $966 | +10% $1,159 |
| Rate | -1.0pp $1,000 | -0.5pp $888 | base $773 | +0.5pp $657 | +1.0pp $538 |
4-unit breakdown (identical units grouped — click to expand)
| Units | Beds | Baths | Est. rent |
|---|---|---|---|
| 2× units | 1 | 1 | $2,204 |
| #1 | 1 | 1 | $1,102 |
| #2 | 1 | 1 | $1,102 |
| 2× units | 2 | 1 | $2,672 |
| #3 | 2 | 1 | $1,336 |
| #4 | 2 | 1 | $1,336 |
| Total (4 units) | $4,877 | ||
UW: 25.0% down · 7.5% · 30yr · 1.5% tax · 5.0% vac · 8.0% maint · 8.0% mgmt
Financing live
Cash to close
- Down payment
- $112,500
- Closing costs
- $13,500
- Reserves months
- —
- Total cash needed
- —
Loan-product check · same deal, 3 products live
Conventional
25% down · 7.5% · 30yr
- Down + closing
- —
- Monthly P&I
- —
- Monthly cashflow
- —
- DSCR
- —
- Eligible?
- —
Personal DTI + credit; lowest rate.
DSCR
20% down · 8.5% · 30yr
- Down + closing
- —
- Monthly P&I
- —
- Monthly cashflow
- —
- DSCR
- —
- Eligible?
- —
No personal income docs; deal must DSCR.
Hard money
10% down · 12.0% · 12mo
- Down + closing
- —
- Monthly P&I
- —
- Monthly cashflow
- —
- DSCR
- —
- Eligible?
- —
Short-term bridge; refi at stabilization.
Listing history 21 events
-
2026-06-21statusdays on market $450,000 Contingency Pending 10 DOM
-
2026-06-18days on market $450,000 Active 7 DOM
-
2026-06-17days on market $450,000 Active 6 DOM
-
2026-06-16days on market $450,000 Active 5 DOM
-
2026-06-15days on market $450,000 Active 4 DOM
-
2026-06-13days on market $450,000 Active 2 DOM
-
2026-06-13statusdays on market $450,000 Active 1 DOM
-
2026-06-09days on market $450,000 Contingency Pending 39 DOM
-
2026-06-08days on market $450,000 Contingency Pending 38 DOM
-
2026-06-07days on market $450,000 Contingency Pending 37 DOM
-
2026-06-03days on market $450,000 Contingency Pending 33 DOM
-
2026-06-02statusdays on market $450,000 Contingency Pending 32 DOM
-
2026-06-01days on market $450,000 Active 31 DOM
-
2026-05-31days on market $450,000 Active 30 DOM
-
2026-05-01$450,000 Active
-
2005-05-27soldstatus $202,000
-
2005-04-28soldstatus $202,000 199-char remark
Show marketing remark (199 chars)
Lovely bldg. through-out and well maintained.Super nice wood floors,and beautiful tile baths.Newer hot water heat. Tenants pay own elect. and a/c.Is located on the bus line.4 car rear entry garage.
-
2005-02-22$210,000 199-char remark
Show marketing remark (199 chars)
Lovely bldg. through-out and well maintained.Super nice wood floors,and beautiful tile baths.Newer hot water heat. Tenants pay own elect. and a/c.Is located on the bus line.4 car rear entry garage.
-
2002-05-09soldstatus $163,000
-
2002-04-23soldstatus $163,000 146-char remark
Show marketing remark (146 chars)
Hard To Find Brick 4-family In Wonderful Shape. Hardwood Throughout. Great Opportunity Knocking On The Door; Long Term Tenants, All Month-to-month
-
2002-03-27$169,900 146-char remark
Show marketing remark (146 chars)
Hard To Find Brick 4-family In Wonderful Shape. Hardwood Throughout. Great Opportunity Knocking On The Door; Long Term Tenants, All Month-to-month
ⓘ Source: listings_history table (triggers on properties + properties_extension) + one-shot
backfill from property_details.listing_events for pre-trigger history.
Tax reassessment forecast OH · Partial reset (capped growth)
- Current annual tax
- $6,385 · $532/mo
- Projected year-2 tax
- $6,702 · $559/mo
- Expected delta
- +$318/yr (+$26/mo · 5.0%)
ⓘ Screening estimate from a state-policy table — verify with the county assessor before closing.
Climate risk First Street
- Flood 5/10 Major FEMA zone X (unshaded) · 24% chance over 30 yrs
- Wildfire 1/10 Low
- Heat 5/10 Major 7 d/yr ≥102°F today · 19 d/yr by 30 yrs out
- Wind 2/10 Low 100% chance of damaging wind over 30 yrs
- Air quality 3/10 Moderate 2 unhealthy d/yr today · 4 by 30 yrs out
Nearby sold comps map
Loading sold comps map…
Walkable amenities ~0.75 mi
Loading nearby amenities…
Taxation est. · year 1
- Rental income
- $58,524
- − Mortgage interest
- −$25,207
- − Property taxes
- −$6,385
- − Insurance
- −$2,250
- − Repairs & maintenance
- −$4,682
- − Management
- −$4,682
- − Depreciation
- −$13,091
- Taxable income
- $2,228
- Est. tax owed @ 24.0%
- −$535
- After-tax cash flow
- $8,746/yr
For passive investors: Depreciation is non-cash, so a rental often shows a tax loss while cash-flowing — sheltering income. Rental losses are passive: they offset passive income freely, and up to $25,000/yr can offset ordinary (W-2) income if you actively participate and your MAGI is under $100k (phasing out to $0 by $150k); unused losses carry forward. On sale, claimed depreciation is recaptured at up to 25%, and gains may owe capital-gains tax (a 1031 exchange can defer both). Figures are a year-1 estimate at your 24.0% rate — not tax advice; consult a CPA.
Schools (NCES district)
- District
- Cincinnati Public Schools
- NCES district ID
- 3904375
- Math proficiency
- 25% ▼ -19.00%
- Reading proficiency
- 36% ▼ -14.00%
- Median HH income
- $35,743
- Composite
- 25.21/100
- National rank
- #7508
- State rank
- #581 of 656 in OH
Livability — Cincinnati
- Score
- 80/100
- State rank
- #130
- US rank
- #1856
Category grades
Schools grade is shown separately in the Schools card above.
Census & demographics
- Census place
- Cincinnati, OH
- County
- Hamilton County · 701,295 people
- City population
- 505,555
- Metro
- Cincinnati, OH-KY-IN
- Population (ZIP)
- 27,501
- Household income
- $89,516
- Rent vs Own
- Severe rent burden
- 527.0
Population outlook (Hamilton County) Hauer SSP2
- Today (2025)
- 826,054 people
- By 2030
- 830,947 · +0.6%
- By 2040
- 832,319 · +0.8%
- By 2050
- 822,428 · -0.4%
- By 2075
- 788,688 · -4.5%
- By 2100
- 710,674 · -14.0%
Race, ethnicity, and origin ACS 2023
- Neighborhood character
- Predominantly White (86%)
- Race & ethnicity
- White 86% Two or more races 7% Hispanic / Latino 4% Black 4% Asian 1%
- Common ancestry
- Romanian 2% Iranian 2% Slovak 2%
- Foreign-born
- 3% · Canada, South Korea
- Languages at home
- 95% English-only · Spanish 3% German/W. Germanic 1%
Political lean MEDSL · Hamilton
- 2024 margin
- D (+14.9) · D 57.0% · R 42.1%
- 2008→2024 swing
- +7.9pp toward D · 2008: 7.0pp · 2024: 14.9pp
- All cycles
- 2024: D+14.9 2020: D+15.9 2016: D+9.5 2012: D+4.9 2008: D+7.0
Not yet ingested
- Civics
- —
Market trends
- HPI YoY
- ▼ -231.96%
- Current HPI
- 224.6954
- Rent YoY
- ▲ 2.39%
- Metro
- Cincinnati, OH-KY-IN
- State GDP YoY
- ▲ 1.98%
- F500 in state
- 48
Industry mix (Fortune 500 HQ in OH)
| Industry | F500 HQs | Revenue |
|---|---|---|
| Insurance | 3 | $145B |
|
||
| Industrial Machinery | 3 | $49B |
|
||
| Financial Services | 3 | $24B |
|
||
| Consumer Goods | 2 | $93B |
|
||
| Aerospace / Defense | 2 | $47B |
|
||
| Utilities | 2 | $33B |
|
||
Price history
+164.9% since first listed7 events — show timeline
- 2026-05-01 Listed $450,000 Cincy MLS
- 2005-05-27 Sold (Public Records) $202,000 Public Records
- 2005-04-28 Sold (MLS) $202,000 Cincy MLS
- 2005-02-22 Listed $210,000 Cincy MLS
- 2002-05-09 Sold (Public Records) $163,000 Public Records
- 2002-04-23 Sold (MLS) $163,000 Cincy MLS
- 2002-03-27 Listed $169,900 Cincy MLS
Property tax history
+1.8%/yrLatest (2025): $6,385 · +0.7% YoY. Source: county tax records.
Cash-flow waterfall
monthlySold comps — $/sqft
last 12 mo · ≤1 miLoading sold comps…