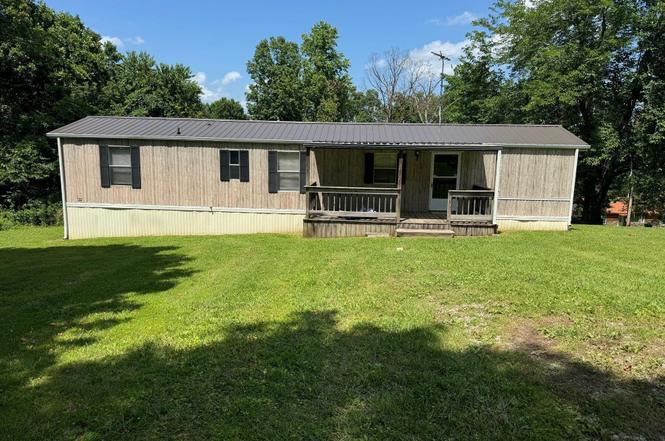
4760 Nolin Dam Rd
Brownsville, KY 42259
$125,000D
2 bd · 1.0 ba ·
960 sqft ·
Built 1999
· Manufactured
· Active
· 10 DOM
Cashflow @ list (25.0% down · 7.5%)
Estimated rent
$881/mo
Mortgage (P&I)
−$656
Tax + insurance
−$82
HOA
−$13
Vac / Maint / Mgmt
−$185
Net cashflow
$-55/mo
Annual
$-658/yr
Cap rate
5.77%
Cash-on-cash
-1.88%
DSCR
0.92
1% rule
0.70%
Cash to close
$35,000
Investor read
- This is a 2-bed/1.0-bath manufactured listed at $125k.
- At list price, monthly cash flow is $-55 ($-658/yr) — negative.
- To cash-flow at today's rent, offer at most $115k (7.7% below list).
- To meet the 1% rule (rent ≥ 1% of price), the offer needs to be $88k (29.6% below list).
- Only 10 days on market — expect competitive offers; lowballing is unlikely to land.
- Recommended offer: $88k (29.6% below list) — sets the bar for 1% rule.
- In year one you build about $3k of equity ($864 loan paydown + $3k appreciation (2.1% local appreciation)).
- Location reads 66/100 on livability (#234 in KY) — a middle-class / working-renter tenant base. Strengths: crime A+, cost of living A+, housing A+; Watch: amenities F, commute F, employment F.
- Edmonson County (rural): math 31% / reading 43% proficiency, ranked #53 of 165 in KY (top 32%) — families likely to look elsewhere, expect single-tenant / working-renter base with shorter leases.
- Zoned schools: Kyrock Elementary School (math 62% / reading 57%, grade B-, #35 of 676 statewide, top 6%, 299 students, 54% FRL); Edmonson County Middle School (math 33% / reading 41%, grade F, #80 of 217 statewide, top 41%, 280 students, 48% FRL); Edmonson County High School (math 22% / reading 42%, grade F, #97 of 254 statewide, top 46%, 592 students, 54% FRL) — zoned schools at 52% FRL track the district average.
- Market conditions: 40 active listings in the ZIP.
- Edmonson County population projected at -16% by 2050 — secular population decline; favor cash flow + early exit over multi-decade hold.
- At projected returns (2.1% appreciation + 3.0% rent growth), your $35k cash investment doubles in ~9 years — after that, you're playing with house money.
- By year 10, paydown + projected appreciation supports a ~$34k cash-out refi (75% LTV) — recoverable capital for the next deal without selling this one.
- Cap rate 5.8% vs local median 3.2% in Brownsville — top-decile yield for the area; either an underpriced asset or a hidden risk that comps aren't pricing in. Stress-test before assuming the spread holds.
Questions for listing agent
- What do current leases actually rent for vs. the listed asking? Can we see a recent rent roll and the last 12 months of T-12 income?
- What does the HOA fee cover, when was the last increase, and are there any pending special assessments or reserve-fund shortfalls?
- Is there a deadline driving the sale (1031 exchange, divorce, estate, relocation)? That informs how much negotiation room exists.
- Schools are D-rated, which usually means shorter tenancies and higher turnover. Who's the typical renter profile here, and what's been the actual vacancy rate?
- The area grade is low — what's the realistic commute time and amenity access for the typical tenant pool here? Any planned neighborhood developments (good or bad) we should know about?
- What's the average days-on-market for RENTAL listings here right now (not sales)? A rising rental-DOM trend means longer vacancies and softer asking-rent achievability than the comps imply.
- What's the recent tenant-quality profile in this submarket — average credit score on applications, eviction rate, late-payment / NSF rate, and stable-employment percentage? A property-management company in the area should have these aggregated.
- How much new for-sale + rental construction is in the pipeline within 1–3 miles? Heavy new supply typically softens prices + rents 12–24 months out; constrained supply supports both.
CashFlowRE · CFR-8WN7VS59A4AH2J
· Data 23 h ago
cashflowre.app · 2026-05-29