4760 Nolin Dam Rd · Brownsville, KY
Flood risk 1/10 · Minimal
- FEMA flood zone
- X (unshaded)
- Chance of flooding over 30 yrs
- 0.0%
- Est. flood insurance / yr
- $507 – $1,088
Fire risk 3/10 · Minor
- Est. fire insurance / yr
- $839 – $1,559
Heat risk 4/10 · Minor
- Hot days now (above 106°F)
- 7 days/yr
- Hot days in 30 yrs
- 19 days/yr
Wind risk 2/10 · Minimal
- Chance of severe wind over 30 yrs
- 4.0%
Air-quality risk 2/10 · Minimal
- Unhealthy air days now
- 1 days/yr
- Unhealthy air days in 30 yrs
- 2 days/yr
Risk factors via First Street. Map © Google.
Why this score? — see what drove the D grade
The composite is a weighted blend of 9 inputs, each scored 0–100. Each bar is that input's sub-score; the figure is the points it added to the 100-point composite (weight × sub-score).
- Cash flow +10.9/30.0
- ARV discount +7.5/15.0
- Appreciation +6.0/10.0
- Livability +3.3/5.0
- DSCR +3.2/10.0
- Schools +3.1/10.0
- Rent growth +2.5/5.0
- Condition / age +2.5/5.0
- 1% rule +2.0/10.0
$125,000
🖨 Deal sheet (PDF) 📄 Offer letter ✓ Due diligence
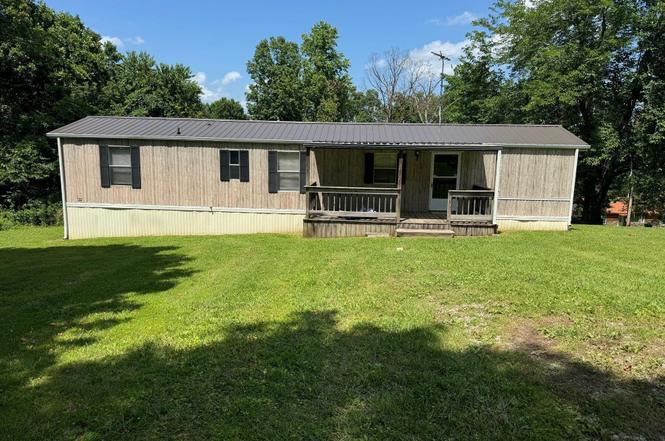
Listing remarks
Lake life is calling! This 1-acre getaway with a 2 bedroom, 1 bath home puts you just 5 minutes from the boat ramp, perfect for weekend escapes, fishing trips, or The closest boat ramp is the Nolan River Lake Tailwater Boat Ramp (also known as the Arnold Van Meter or Site One ramp), located directly adjacent to the dam. The dam and ramp are located virtually at the same site: Head southwest on Nolin Dam Rd / State Hwy 728 toward the dam structure. Turn off toward the Tailwater Recreation Area at the base of the dam. The total distance is under 1 mile, taking less than 3 minutes of driving. Access: paved, multi-lane year-round access for light trailerable boats and paddle craft. Fees: U. S.
Key facts
- 1 acre lot
- Built 1999
- Listed 10 days
Property features AI
Finance
- Other: Property in the Cave Hollow Bay subdivision
- HOA & community: Homeowners association with a $150 fee
Exterior
- Utilities: Electricity connected
- Home design: Single-family ranch residence; One story; Built in 1999; Metal roof; Aluminum siding
- Construction: Built in 1999; Aluminum siding construction; Metal roof
- Exterior features: Cleared lot; Lot dimensions approximately 160' x 200'
Interior
- Kitchen: Kitchen located on the first floor
- Bedrooms: Two bedrooms, both on the first floor
- Bathrooms: One full bathroom on the first floor
- Heating & cooling: Electric heating; Forced air heating; Heat pump providing heating and cooling
- Interior features: Four total rooms; Two closets; No basement; First-floor primary bedroom
- Laundry & utility: First-floor laundry
Neighborhood map
What this means for you Summary
Snapshot
- This is a 2-bed/1.0-bath manufactured listed at $125k.
Deal economics
- At list price, monthly cash flow is $-55 ($-658/yr) — negative.
- To cash-flow at today's rent, offer at most $115k (7.7% below list).
- To meet the 1% rule (rent ≥ 1% of price), the offer needs to be $88k (29.6% below list).
- Recommended offer: $88k (29.6% below list) — sets the bar for 1% rule.
- Cap rate 5.8% vs local median 3.2% in Brownsville — top-decile yield for the area; either an underpriced asset or a hidden risk that comps aren't pricing in. Stress-test before assuming the spread holds.
Location & tenants
- Location reads 66/100 on livability (#234 in KY) — a middle-class / working-renter tenant base. Strengths: crime A+, cost of living A+, housing A+; Watch: amenities F, commute F, employment F.
- Edmonson County (rural): math 31% / reading 43% proficiency, ranked #53 of 165 in KY (top 32%) — families likely to look elsewhere, expect single-tenant / working-renter base with shorter leases.
- Zoned schools: Kyrock Elementary School (math 62% / reading 57%, grade B-, #35 of 676 statewide, top 6%, 299 students, 54% FRL); Edmonson County Middle School (math 33% / reading 41%, grade F, #80 of 217 statewide, top 41%, 280 students, 48% FRL); Edmonson County High School (math 22% / reading 42%, grade F, #97 of 254 statewide, top 46%, 592 students, 54% FRL) — zoned schools at 52% FRL track the district average.
- Market conditions: 40 active listings in the ZIP.
Forward outlook
- In year one you build about $3k of equity ($864 loan paydown + $3k appreciation (2.1% local appreciation)).
- Edmonson County population projected at -16% by 2050 — secular population decline; favor cash flow + early exit over multi-decade hold.
- At projected returns (2.1% appreciation + 3.0% rent growth), your $35k cash investment doubles in ~9 years — after that, you're playing with house money.
- By year 10, paydown + projected appreciation supports a ~$34k cash-out refi (75% LTV) — recoverable capital for the next deal without selling this one.
Negotiation context
- Only 10 days on market — expect competitive offers; lowballing is unlikely to land.
Questions for the listing agent
- What do current leases actually rent for vs. the listed asking? Can we see a recent rent roll and the last 12 months of T-12 income?
- What does the HOA fee cover, when was the last increase, and are there any pending special assessments or reserve-fund shortfalls?
- Is there a deadline driving the sale (1031 exchange, divorce, estate, relocation)? That informs how much negotiation room exists.
- Schools are D-rated, which usually means shorter tenancies and higher turnover. Who's the typical renter profile here, and what's been the actual vacancy rate?
- The area grade is low — what's the realistic commute time and amenity access for the typical tenant pool here? Any planned neighborhood developments (good or bad) we should know about?
- What's the average days-on-market for RENTAL listings here right now (not sales)? A rising rental-DOM trend means longer vacancies and softer asking-rent achievability than the comps imply.
- What's the recent tenant-quality profile in this submarket — average credit score on applications, eviction rate, late-payment / NSF rate, and stable-employment percentage? A property-management company in the area should have these aggregated.
- How much new for-sale + rental construction is in the pipeline within 1–3 miles? Heavy new supply typically softens prices + rents 12–24 months out; constrained supply supports both.
Investment metrics
- 1% rule
- 0.70% ✗
- Cap rate
- 5.77%
- Cash-on-cash
- -1.88%
- DSCR
- 0.92
- GRM
- 11.8
CMA / ARV
No comps found within radius.
Projected returns pro-forma
2.06% appreciation · 3.0% rent growth · sell at horizon
- IRR
- 2.9%
- Equity multiple
- 1.15×
- Total profit
- $5,415
- Equity at exit
- $49,721
- IRR
- 6.7%
- Equity multiple
- 1.91×
- Total profit
- $31,994
- Equity at exit
- $71,921
Cash invested: $35,000 (down + closing). Projections, not guarantees.
Landlord ↔ Tenant lean methodology
- Overall (STATE)
- 83 Strongly Landlord-Friendly
- State Kentucky
- 83 Strongly Landlord-Friendly · R+16
- County
- — inherits STATE
- City
- — inherits STATE
ZIP-level market 42259
- Home prices YoY
- 1.8%
- Active inventory
- 40
- Price-to-rent
- 11.8×
Monthly cashflow live
- Estimated rent
- $881 medium interval (Pro) →
- Mortgage (P&I)
- −$656
- Tax from tax record
- −$30 /mo · $358/yr
- Insurance
- −$52
- HOA
- −$13
- Vacancy / Maint / Mgmt
- −$185
- Net cashflow
- $-55
Break-even live
Sensitivity live
| Price | -10% $16 | -5% $-19 | +0% $-55 | +5% $-90 | +10% $-126 |
|---|---|---|---|---|---|
| Rent | -10% $-124 | -5% $-90 | +0% $-55 | +5% $-20 | +10% $15 |
| Rate | -1.0pp $8 | -0.5pp $-23 | base $-55 | +0.5pp $-87 | +1.0pp $-120 |
UW: 25.0% down · 7.5% · 30yr · 1.5% tax · 5.0% vac · 8.0% maint · 8.0% mgmt
Financing live
Cash to close
- Down payment
- $31,250
- Closing costs
- $3,750
- Reserves months
- —
- Total cash needed
- —
Loan-product check · same deal, 3 products live
Conventional
25% down · 7.5% · 30yr
- Down + closing
- —
- Monthly P&I
- —
- Monthly cashflow
- —
- DSCR
- —
- Eligible?
- —
Personal DTI + credit; lowest rate.
DSCR
20% down · 8.5% · 30yr
- Down + closing
- —
- Monthly P&I
- —
- Monthly cashflow
- —
- DSCR
- —
- Eligible?
- —
No personal income docs; deal must DSCR.
Hard money
10% down · 12.0% · 12mo
- Down + closing
- —
- Monthly P&I
- —
- Monthly cashflow
- —
- DSCR
- —
- Eligible?
- —
Short-term bridge; refi at stabilization.
HOA detail
- Monthly dues
- $13 · $156/yr
- Likely covers
- water
Listing history 9 events
-
2026-06-21days on market $125,000 Active 10 DOM
-
2026-06-19days on market $125,000 Active 8 DOM
-
2026-06-18days on market $125,000 Active 7 DOM
-
2026-06-17days on market $125,000 Active 6 DOM
-
2026-06-16days on market $125,000 Active 5 DOM
-
2026-06-15days on market $125,000 Active 4 DOM
-
2026-06-14days on market $125,000 Active 2 DOM
-
2026-06-13remarks 699-char remark
-
2026-06-13$125,000 Active 1 DOM
ⓘ Source: listings_history table (triggers on properties + properties_extension) + one-shot
backfill from property_details.listing_events for pre-trigger history.
Tax reassessment forecast KY · Resets to sale price
- Current annual tax
- $358 · $30/mo
- Projected year-2 tax
- $1,075 · $90/mo
- Expected delta
- +$717/yr (+$60/mo · 200.0%)
ⓘ Screening estimate from a state-policy table — verify with the county assessor before closing.
Climate risk First Street
- Flood 1/10 Low FEMA zone X (unshaded) · 0% chance over 30 yrs
- Wildfire 3/10 Moderate
- Heat 4/10 Moderate 7 d/yr ≥106°F today · 19 d/yr by 30 yrs out
- Wind 2/10 Low 4% chance of damaging wind over 30 yrs
- Air quality 2/10 Low 1 unhealthy d/yr today · 2 by 30 yrs out
Nearby sold comps map
Loading sold comps map…
Walkable amenities ~0.75 mi
Loading nearby amenities…
Taxation est. · year 1
- Rental income
- $10,567
- − Mortgage interest
- −$7,002
- − Property taxes
- −$358
- − Insurance
- −$625
- − Repairs & maintenance
- −$845
- − Management
- −$845
- − HOA
- −$156
- − Depreciation
- −$3,636
- Taxable loss
- −$2,902
- Est. tax savings @ 24.0%
- +$696
- After-tax cash flow
- $39/yr
For passive investors: Depreciation is non-cash, so a rental often shows a tax loss while cash-flowing — sheltering income. Rental losses are passive: they offset passive income freely, and up to $25,000/yr can offset ordinary (W-2) income if you actively participate and your MAGI is under $100k (phasing out to $0 by $150k); unused losses carry forward. On sale, claimed depreciation is recaptured at up to 25%, and gains may owe capital-gains tax (a 1031 exchange can defer both). Figures are a year-1 estimate at your 24.0% rate — not tax advice; consult a CPA.
Schools (NCES district)
- District
- Edmonson County
- NCES district ID
- 2101620
- Math proficiency
- 31% ▼ -26.00%
- Reading proficiency
- 43% ▼ -18.00%
- Median HH income
- $38,615
- Composite
- 30.88/100
- National rank
- #6119
- State rank
- #53 of 165 in KY
Livability — Brownsville
- Score
- 66/100
- State rank
- #234
- US rank
- #11426
Category grades
Schools grade is shown separately in the Schools card above.
Census & demographics
- Population (ZIP)
- 1,111
Population outlook (Edmonson County) Hauer SSP2
- Today (2025)
- 12,032 people
- By 2030
- 11,768 · -2.2%
- By 2040
- 11,038 · -8.3%
- By 2050
- 10,147 · -15.7%
- By 2075
- 8,085 · -32.8%
- By 2100
- 6,540 · -45.6%
Race, ethnicity, and origin ACS 2023
- Neighborhood character
- Predominantly White (95%)
- Race & ethnicity
- White 95% Black 3% Two or more races 1%
- Common ancestry
- Slovak 4% Serbian 1%
- Foreign-born
- 2% · Canada
- Languages at home
- 95% English-only · Spanish 3% German/W. Germanic 1%
Political lean MEDSL · Edmonson
- 2024 margin
- Solid R (+62.9) · D 17.9% · R 80.8% · Other 1.3%
- 2008→2024 swing
- -26.7pp toward R · 2008: -36.2pp · 2024: -62.9pp
- All cycles
- 2024: R+62.9 2020: R+58.7 2016: R+60.2 2012: R+39.8 2008: R+36.2
Not yet ingested
- Civics
- —
Market trends
- HPI YoY
- ▲ 2.06%
- Current HPI
- 116.3767
- Rent YoY
- —
- Metro
- —
- State GDP YoY
- ▲ 1.81%
- F500 in state
- 4
Industry mix (Fortune 500 HQ in KY)
| Industry | F500 HQs | Revenue |
|---|---|---|
| Healthcare | 1 | $118B |
|
||
| Food / Beverage | 1 | $7B |
|
||
Price history
1 event — show timeline
- 2026-06-11 Listed $125,000 Metro Search MLS
Property tax history
+8.9%/yrLatest (2025): $358 · +2.5% YoY. Source: county tax records.
Cash-flow waterfall
monthlySold comps — $/sqft
last 12 mo · ≤1 miLoading sold comps…