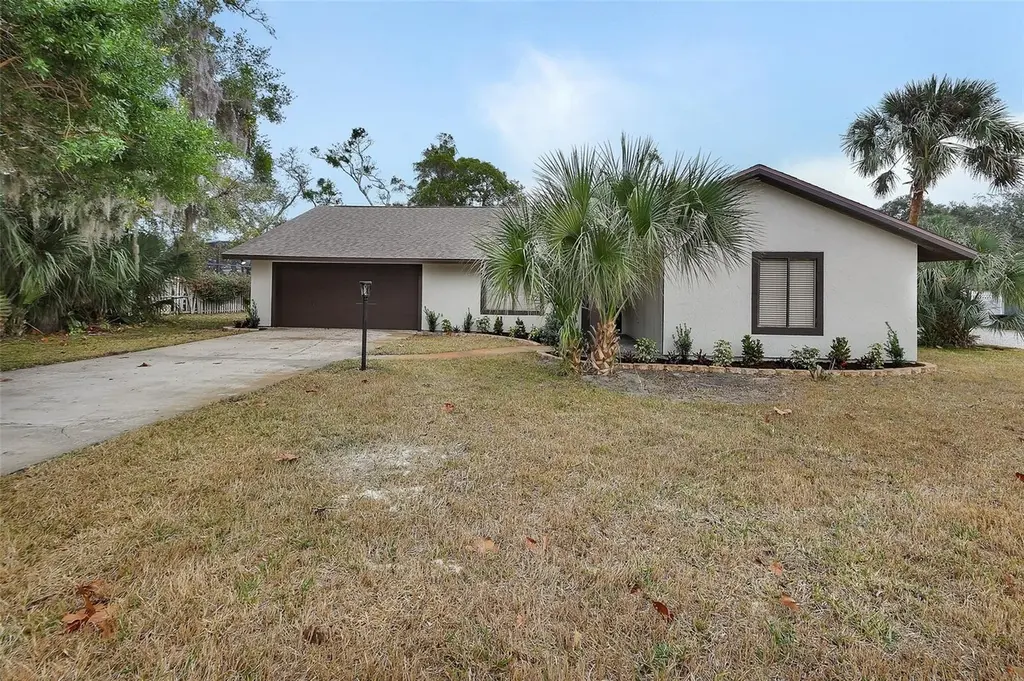
1411 N Beach St
Ormond Beach, FL 32174
$399,900D
3 bd · 2.0 ba ·
2,021 sqft ·
Built 1979
· SingleFamily
· Active
· 159 DOM
Cashflow @ list (25.0% down · 7.5%)
Estimated rent
$2,998/mo
Mortgage (P&I)
−$2,097
Tax + insurance
−$314
HOA
−$0
Vac / Maint / Mgmt
−$630
Net cashflow
$-43/mo
Annual
$-518/yr
Cap rate
6.36%
Cash-on-cash
0.25%
DSCR
1.01
1% rule
0.75%
Cash to close
$111,972
Investor read
- This is a 3-bed/2.0-bath single-family listed at $400k.
- At list price, monthly cash flow is $-43 ($-518/yr) — negative.
- To cash-flow at today's rent, offer at most $392k (1.9% below list).
- To meet the 1% rule (rent ≥ 1% of price), the offer needs to be $300k (25.0% below list).
- It's been on market 159 days — a 12% lower offer ($352k) is reasonable based on typical stale-listing flexibility.
- Recommended offer: $300k (25.0% below list) — sets the bar for 1% rule.
- Local home prices are declining (-3.0%/yr); year-one equity from $3k of loan paydown is wiped out by about $12k of value loss. Plan a longer hold.
- Location reads 83/100 on livability (#55 in FL, #965 nationally) — a professional / high-income tenant draw. Strengths: amenities A+, housing A+, health & safety A+; Watch: commute F.
- Volusia (suburban): math 44% / reading 49% proficiency, ranked #47 of 73 in FL (top 64%) — families likely to look elsewhere, expect single-tenant / working-renter base with shorter leases.
- Watch-outs: flood insurance adds $66/mo.
- Market conditions: Rents rising (+1.6%/yr); 985 active listings in the ZIP; 4 comparable units currently listed for rent nearby; rentals at typical pace (median 24d on market — plan ~3-4 weeks tenant-placement turnaround); 3,402 units permitted in Volusia County in 2024 (681 in 5+ unit buildings).
- Volusia County population projected at +19% by 2050 — long-run rental-demand tailwind backs the buy-and-hold thesis.
- 6 sale attempts; this cycle's ask has dropped $79k (17%) from the opening price — seller is motivated, your offer sets the floor, not the list.
- Current owner paid $280k; 43% above their basis — modest negotiation headroom, anchor on the comps not their cost.
- Climate carrying-cost: severe flood risk; severe wind risk, 99% chance of damaging wind over 30y; extreme-heat days projected 7→21/yr by 2055 (HVAC capex compounding) — expect insurance premiums to compound above CPI over the hold.
- Cap rate 6.4% vs local median 3.9% in Ormond Beach — top-decile yield for the area; either an underpriced asset or a hidden risk that comps aren't pricing in. Stress-test before assuming the spread holds.
- At $2,998/mo this rent would consume 51% of the median local household income ($71k/yr) (locally 1158% of renters already pay >50% of income on rent) — very limited rent-growth headroom before tenants either downsize or default.
Questions for listing agent
- What do current leases actually rent for vs. the listed asking? Can we see a recent rent roll and the last 12 months of T-12 income?
- It's been on market 159 days. Have you received any prior offers? Is the seller open to a 25% concession, seller financing, or rate buy-down credit?
- Built in 1979 — when were the roof, HVAC, electrical panel, plumbing, and water heater last replaced?
- What's the actual annual flood-insurance premium (NFIP or private), and is the property in a SFHA with mandatory coverage?
- Why hasn't it sold? Are there any deal-killer items the seller is aware of (foundation, flood, title, zoning, code violations)?
- Is there a deadline driving the sale (1031 exchange, divorce, estate, relocation)? That informs how much negotiation room exists.
- Schools are B-rated — typically a magnet for longer-tenancy family renters. What's the average tenant stay here, and is there a school-zone premium baked into asking?
- The area grade is low — what's the realistic commute time and amenity access for the typical tenant pool here? Any planned neighborhood developments (good or bad) we should know about?
CashFlowRE · CFR-9020PS3G2A45JB
· Data 5 days ago
cashflowre.app · 2026-05-29