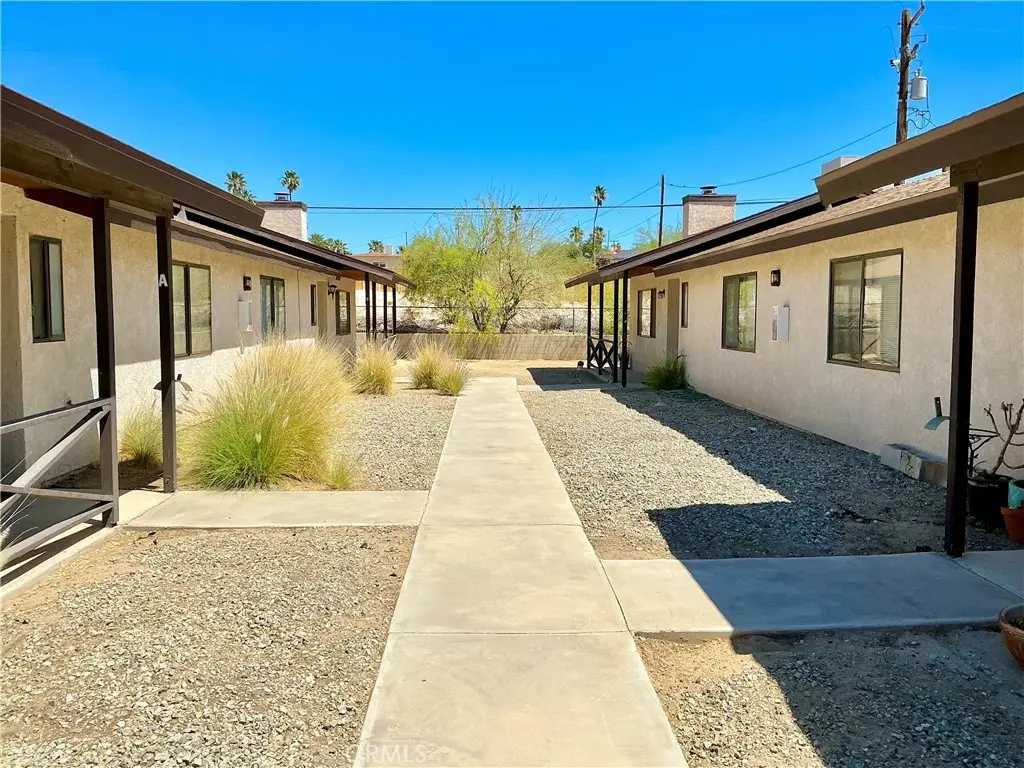
73624 Sunnyvale
Twentynine Palms, CA 92277
$589,000D+
8 bd · 8.0 ba ·
3,808 sqft ·
Built 1985
· MultiFamily
· Active
· 27 DOM
Cashflow @ list (25.0% down · 7.5%)
Estimated rent
$5,615/mo
Mortgage (P&I)
−$3,089
Tax + insurance
−$515
HOA
−$0
Vac / Maint / Mgmt
−$1,179
Net cashflow
$832/mo
Annual
$9,989/yr
Cap rate
7.99%
Cash-on-cash
6.06%
DSCR
1.27
1% rule
0.95%
Cash to close
$164,920
Investor read
- This is a 4 × 2-bed/2.0-bath units multifamily listed at $589k.
- At list price, monthly cash flow is $832 ($10k/yr) — positive. Per door: $208/mo.
- The deal already cash-flows at list — no discount required.
- To meet the 1% rule (rent ≥ 1% of price), the offer needs to be $562k (4.7% below list).
- It's been on market 27 days — a 2% lower offer ($580k) is reasonable based on typical stale-listing flexibility.
- Recommended offer: $562k (4.7% below list) — sets the bar for 1% rule.
- Local home prices are declining (-3.0%/yr); year-one equity from $4k of loan paydown is wiped out by about $18k of value loss. Plan a longer hold.
- Location reads 59/100 on livability (#622 in CA) — a working-class tenant base; expect higher turnover. Strengths: commute A+, housing A+; Watch: schools D, amenities F, employment D-.
- Morongo Unified (town): math 15% / reading 38% proficiency, ranked #395 of 517 in CA (top 76%) — low school quality limits family demand, transient renter base, plan for 1-2y turnover.
- Market conditions: Rents rising fast (+4.5%/yr); 734 active listings in the ZIP; 5,458 units permitted in San Bernardino County in 2024 (1,500 in 5+ unit buildings).
- San Bernardino County population projected at +15% by 2050 — modest demand growth; plan on rents tracking national, not racing it.
- 9 sale attempts since 11y ago with the ask held roughly flat each time — persistent listings suggest the price (not the market) is what's stuck; bring a comps-based counter.
- Current owner paid $235k; list at $589k implies a 151% gain — meaningful room to come down on a strong offer.
- Climate carrying-cost: extreme-heat days projected 7→21/yr by 2055 (HVAC capex compounding) — expect insurance premiums to compound above CPI over the hold.
- Cap rate 8.0% vs local median 4.3% in Twentynine Palms — top-decile yield for the area; either an underpriced asset or a hidden risk that comps aren't pricing in. Stress-test before assuming the spread holds.
- At $5,615/mo this rent would consume 111% of the median local household income ($61k/yr) (locally 1057% of renters already pay >50% of income on rent) — very limited rent-growth headroom before tenants either downsize or default.
Questions for listing agent
- Can we see the unit-by-unit rent roll, current vacancy, and any below-market leases? What's the average tenancy length?
- What capital expenditures (roof, boiler, parking lot, exteriors) have been made in the last 5 years, and what's planned in the next 2?
- Is there a deadline driving the sale (1031 exchange, divorce, estate, relocation)? That informs how much negotiation room exists.
- Schools are D-rated, which usually means shorter tenancies and higher turnover. Who's the typical renter profile here, and what's been the actual vacancy rate?
- The area grade is low — what's the realistic commute time and amenity access for the typical tenant pool here? Any planned neighborhood developments (good or bad) we should know about?
- What's the average days-on-market for RENTAL listings here right now (not sales)? A rising rental-DOM trend means longer vacancies and softer asking-rent achievability than the comps imply.
- What's the recent tenant-quality profile in this submarket — average credit score on applications, eviction rate, late-payment / NSF rate, and stable-employment percentage? A property-management company in the area should have these aggregated.
- How much new apartment / multifamily construction is in the pipeline within 1–3 miles? Heavy new supply (>2% of stock underway) typically softens rents 12–24 months out; light construction supports rent growth.
CashFlowRE · CFR-91CE53BB3KD8RS
· Data 2 days ago
cashflowre.app · 2026-05-29